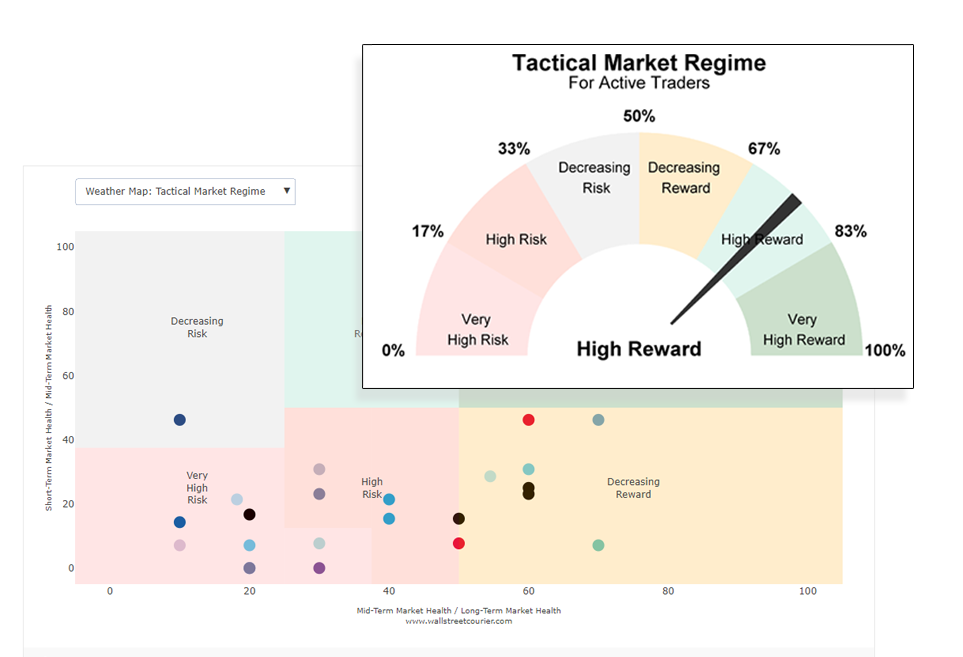
| | Daily Market Info |  | Momentum, 52 Week Highs, 52 Week Lows, What's Hot - What's Not, Dow Jones 30, Volume Leaders, XAU, Price Advances - Price Declines, Percent Advances - Percent Declines, Major Market Indices, Breadth Indicators, Short Interest NASDAQ, Short Interest NYSE, Live Gold Quotes |
|
|
WELCOME
TO THE SITE OF TECHNICAL INDICATORS !
Thank
you for visiting our site. The following pages will offer you a wealth
of information about the financial markets. We provide our subscribers
with charted data from official sources and some of the finest indicators
available. Top performing money managers, savvy investors, institutions
and pension funds are relying on them. Like Wall Street's most closely-guarded
secret, the Smart
Money Flow Index for instance, which is also featured on
the BLOOMBERG PROFESSIONAL Service under SMART <Index> <GO>.
Get the best tips about technical market analysis you may ever receive
and learn the secrets of Wall Street's wealthiest market players about
market timing. There is a 6-year historical chart of each indicator
enclosed as a track record for your convenience.
Just
compare our indicators with the linked charts of the S&P 500 and
the Dow Jones, and you will soon know why we became such a respected
source for financial information on the web. All indicators are listed
in our Site Map and also described
and explained in our free E-Book
of Technical Market Indicators. 100% guaranteed that you
won't see charts and indicators like ours anywhere in the web. We offer
also a weekly Indicator
Watch column where we interpret our charts and single out
indicators which give strong signals.
Buying
opportunity or last chance to get out? Find out what the Wall Street
pros are doing now!!
How
the Smart Money Flow Index called the October top!
Some
eye opening charts for those who are serious about technical analysis
!
Find
out what the Wall Street pros are doing! 100 % guaranteed that you won't
find such charts anywhere on the web!
There
has never been a more important time than now to become a member
of Wall Street Courier and take advantage of our information-packed
site!
| Daily
Market Statistics |
|
Fri |
Mon |
Tue |
Wed |
Thu |
Fri |
| S&P
500 (SPX) |
|
1413,90 |
1407,49 |
1418,26 |
1392,57 |
1397,68 |
1388,28 |
| Futures
Premium M8 |
|
1,90 |
0,81 |
2,44 |
2,73 |
-5,68 |
0,72 |
| Advancing
Issues |
|
1,776 |
1,332 |
1,963 |
896 |
1,826 |
1,420 |
| Declining
Issues |
|
1,343 |
1,806 |
1,177 |
2,263 |
1,311 |
1,687 |
| Total
Issues |
|
3,238 |
3,237 |
3,249 |
3,260 |
3,228 |
3,223 |
| Up
Volume |
|
736,896 |
450,484 |
831,660 |
221,264 |
658,261 |
392,669 |
| Down
Volume |
|
511,172 |
639,758 |
379,564 |
1,046,665 |
541,146 |
692,159 |
| Total
Volume |
|
1,265,302 |
1,104,192 |
1,228,039 |
1,275,977 |
1,208,694 |
1,097,837 |
| New
Highs |
|
83 |
50 |
111 |
99 |
71 |
88 |
| New
Lows |
|
22 |
25 |
31 |
40 |
55 |
54 |
| Arms
(Trin) |
|
0,92 |
1,05 |
0,76 |
1,87 |
1,15 |
1,48 |
| Closing
Tick |
|
98 |
102 |
689 |
-241 |
593 |
297 |
| CBOE
Put/Call Ratio |
|
0,90 |
0,90 |
0,82 |
1,03 |
0,89 |
0,93 |
| VIX |
|
18,18 |
18,90 |
18,21 |
19,73 |
19,40 |
19,41 |
| Odd
Lot Purchases |
|
9369,4 |
6867,6 |
7790,5 |
8010,6 |
7458,5 |
|
| Odd
Lot Sales |
|
4814,8 |
4524,6 |
4717,9 |
5416,8 |
4734,3 |
|
| Odd
Lot Short Sales |
|
3059,9 |
3470,6 |
3045,0 |
4451,7 |
4123,9 |
|
Are you tired of
losing money in the market? Are you searching for the breakthrough formula
or the Holy Grail of the stock market? Would you like to have the same
competitive edge as some of the most successful traders and investors
on Wall Street? You'd never guess how simple but powerful the answer
is. The only intelligent way to approach the market is simply to watch
what the so called "Smart
Money" is doing and you can eliminate much of the stress
by calmly following what the pros do. Almost everyone has heard of "Smart
Money", "Dumb
Money" and the so called "Crowd",
and that is exactly what our indicators are all about. One of our sources
is the weekly NYSE
Member Report by the SEC. Just ask yourself these questions:
Would you be a buyer if you see that the public and the odd-lot investors
(dumb
money) go on a buying spree while the "Smart
Money" like NYSE
specialists and NYSE
members (all the well known Wall Street broker firms) are
heavily short at the same time? Do you know when to part company with
the crowd and take profits? The key is knowing what the smart guys are
doing and nothing else compares to to our Smart
Money Flow Index, the closely guarded secret of the Wall
Street pros until now. This magnificent indicator has called every major
top and bottom since we are online.
Charts
on the visitors site (except Daily
Market Indicators and Charts
of Interest) are for demonstration purposes only and delayed
for several months. The updated version of Wall Street Courier
including all our proprietary indicators is only available to our members.
If our site meets your demand, we invite you to become a
subscriber to one of the best financial sites on the
web.
For Members Only: Daily update of the Smart Money Indicator for active traders in our Day Trader Section!
Get
instant access to our members section now!
Interested in Technical Analysis? Please visit our Site Map!  | |
|