Unlock a clear and comprehensive understanding of prevailing market dynamics
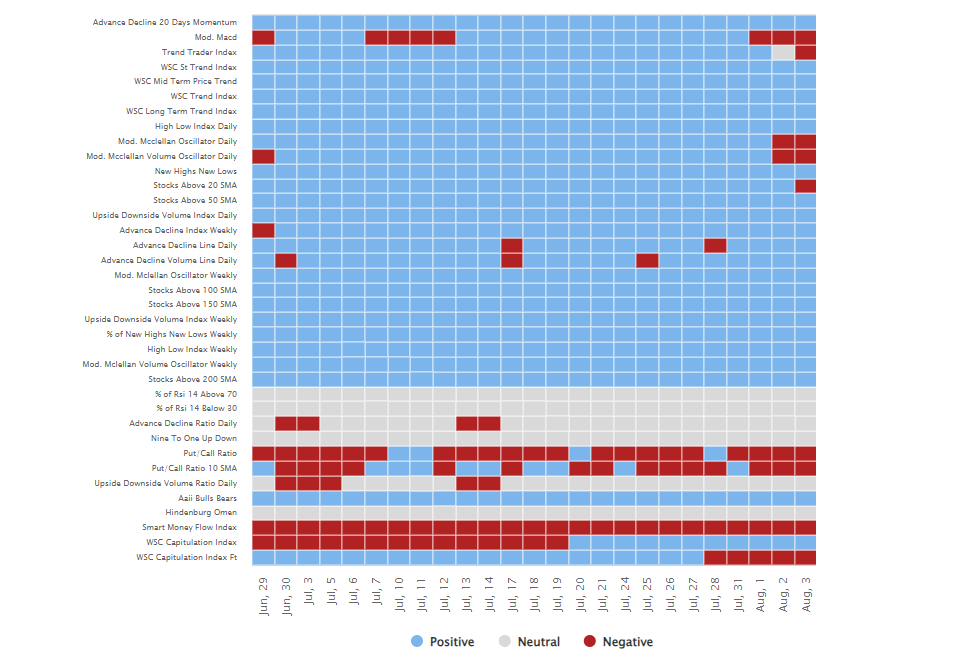
Screen hundrets of indicators in less than a minute
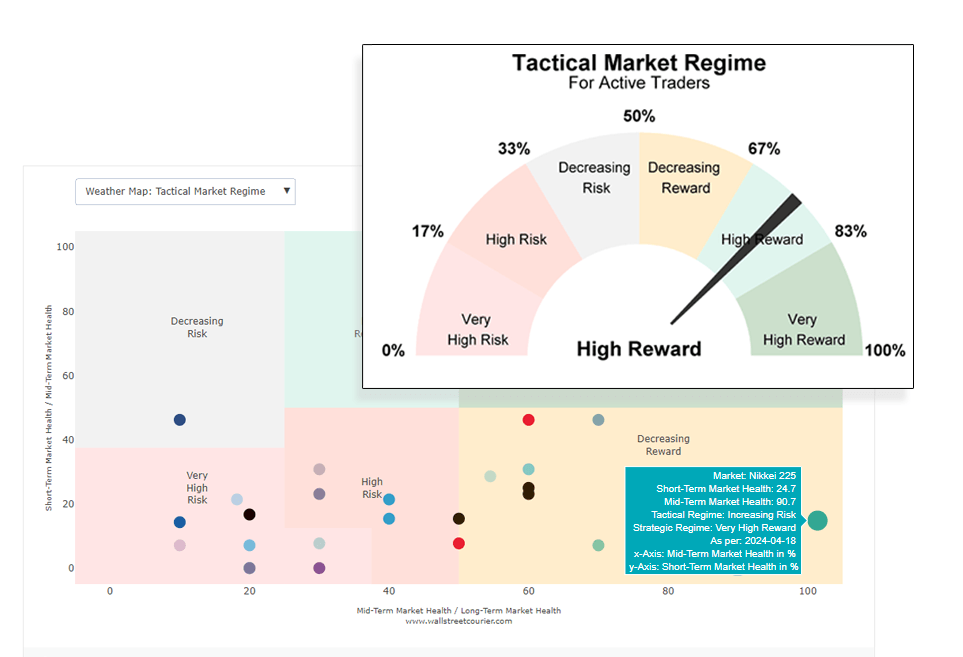
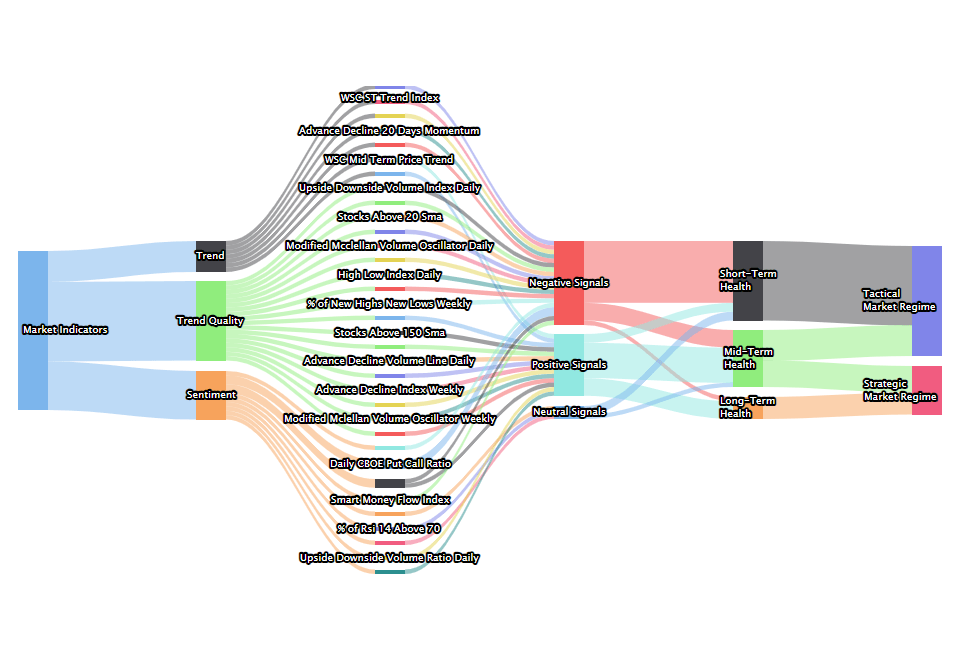
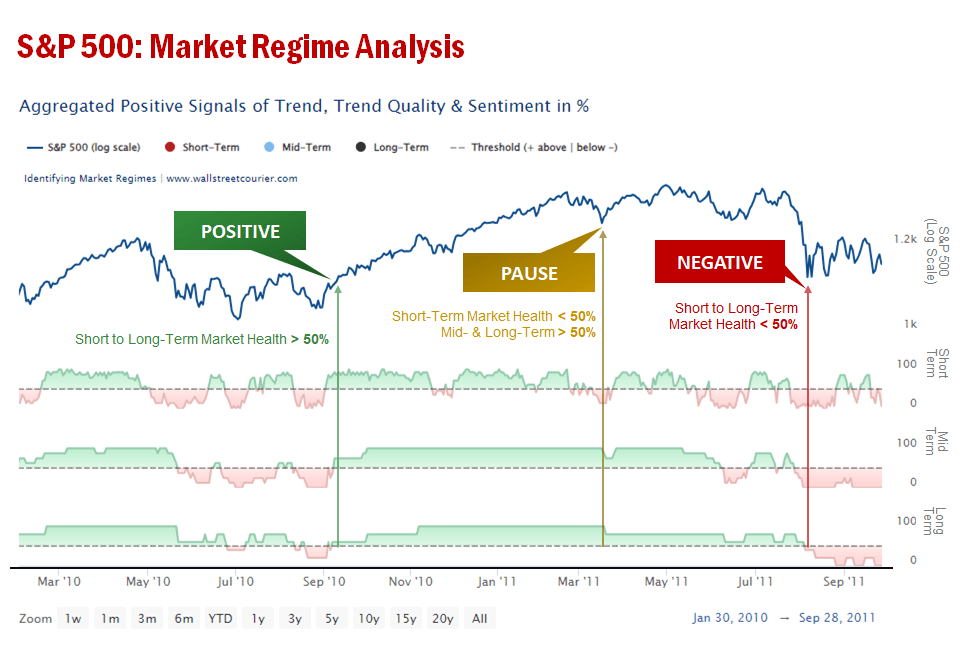
Our market regime research combines signals from trend, trend quality and sentiment indicators as well as smart money positioning across three time frames.
By combining short- to mid-term and mid-term to long-term market health readings, the specific market regime is determined.
Benefit from detailed signal breakdowns to unlock a clear and comprehensive understanding of prevailing market dynamics.
Market regimes are acting like a daily data-driven weather report for financial markets. Gain valuable insights effortlessly, without decoding conflicting signals or dealing with complex reports.
Gain instant insights into high-reward market regimes and potential shifts across numerous market and sectors. Navigate the investment landscape like a pro and master the art of top-down analysis.
Spend less time on contradicting signals and more time making profitable investments
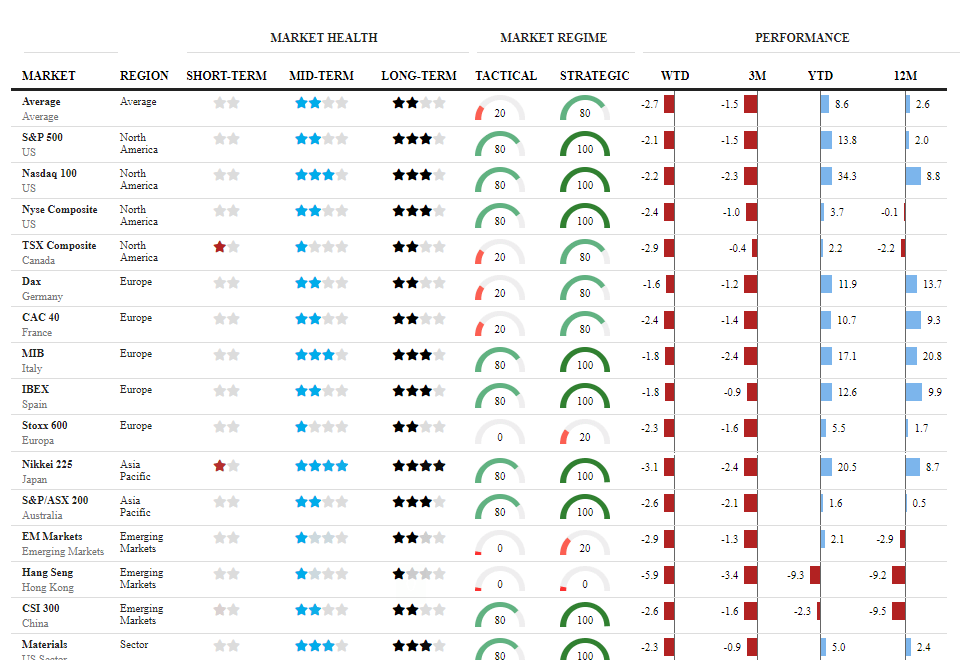
Monitor market health over time
Profitable market regimes are built on the foundation of market health, derived from bundling dozens of well-tested market indicator signals across three different time frames.
Gain valuable insights into the health condition of numerous markets and sectors over time.
Utilize our interactive charts to closely monitor market health conditions over time.
Market regimes mirror weather conditons in investing
The Idea Behind Market Regimes
We always compare investing with sailing. On a beautiful day, navigating a ship is a simple and enjoyable task. When market conditions are favorable, it is easy to pick the right security as the tide lifts all boats.
However, just like the weather at sea can change rapidly, market conditions can also shift unpredictably, causing years of gains to be wiped out, often within a few days. Even the concept of diversification could falter in certain market environments. As a result, skillfully avoiding unfavorable market regimes becomes paramount for long-term success.
With our unique data-driven methodology, you can efficiently narrow down single market regimes based on indicator signals, enabling more targeted decision-making.
Our approach combines the precision of data analysis with a holistic view of the big picture, providing you with a comprehensive advantage.
Perform advanced track-record analysis with our interactive charts
Single indicator screening
One-stop hub to hundrets of classic and proprietary indicators classified by category and time frame.
Dive deep into the world of indicators, all conveniently located on a single site.
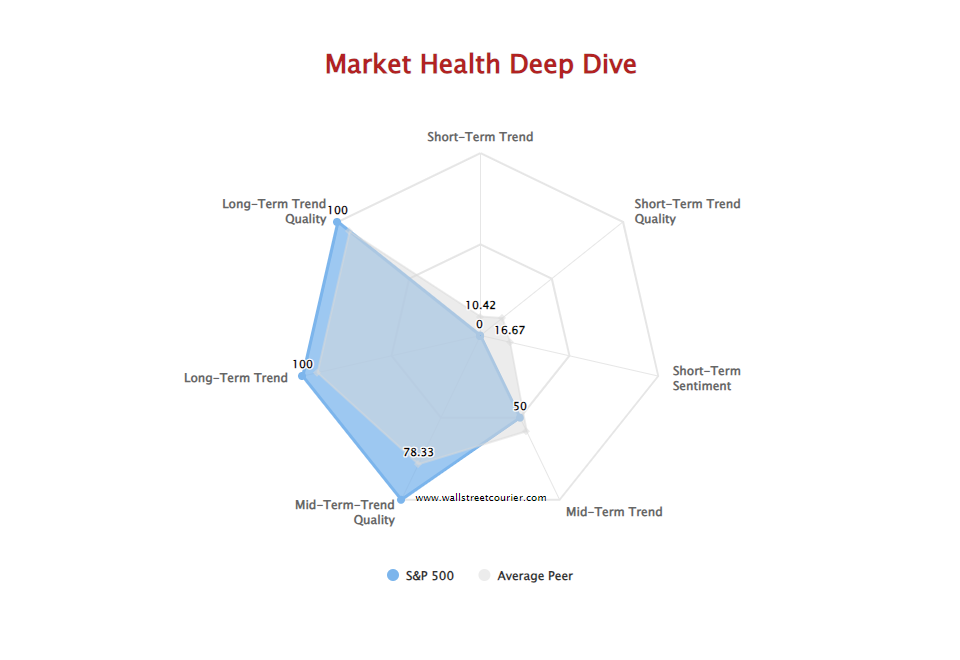
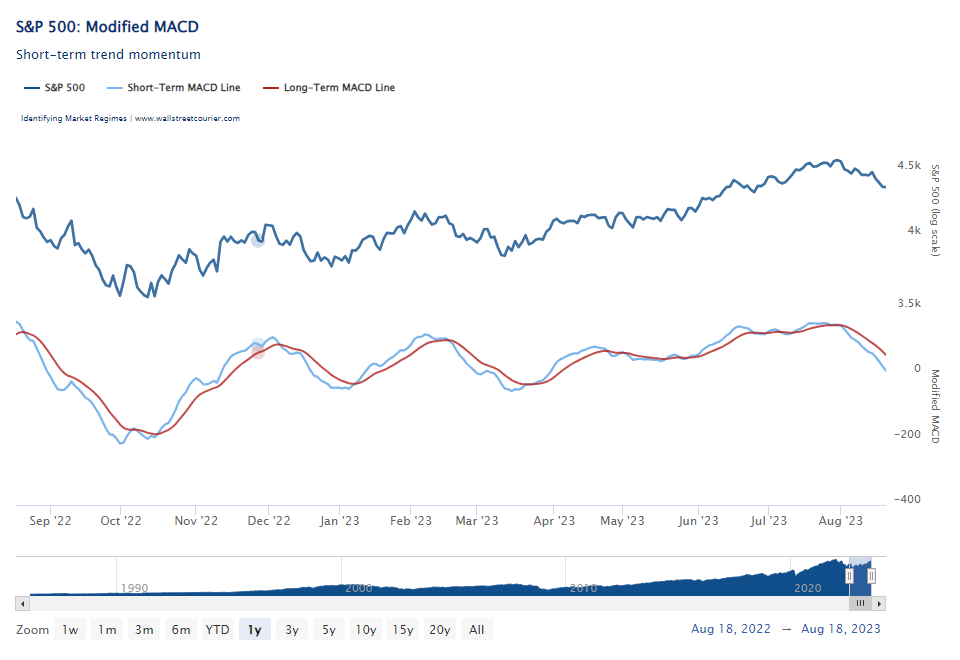
Our interactive charts provide a user-friendly experience, allowing you to perform advanced track-record analysis. Uncover valuable insights and gain a deeper understanding of market trends and patterns.
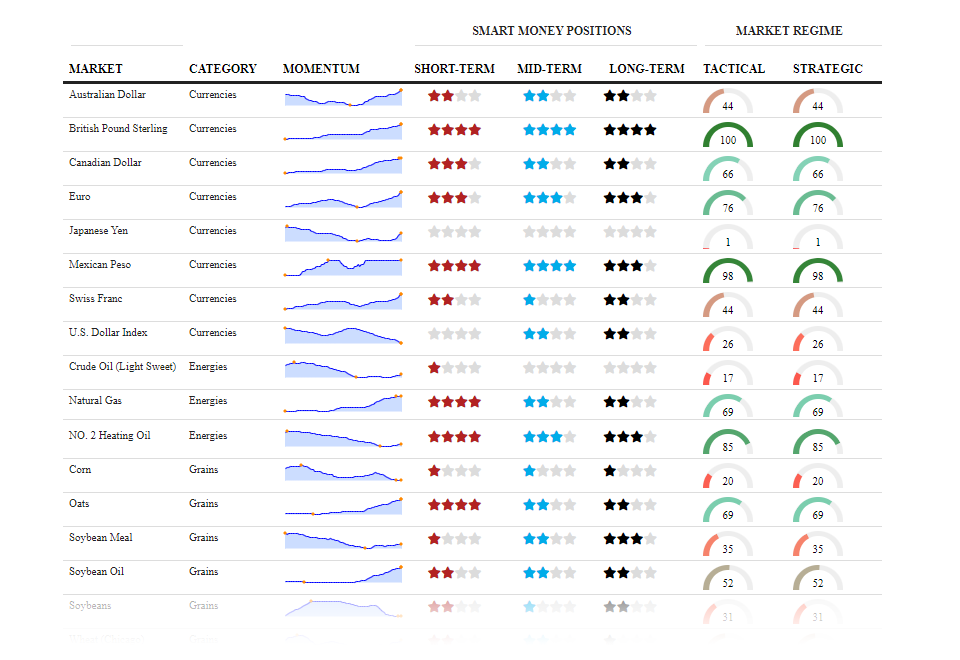
The Smart Money Flow Index (SMFI) has long been one of the best kept secrets of Wall Street. Almost everyone has heard of “Smart Money”, “Dumb Money” and the so called “Crowd”, and that is exactly what our indicators are all about. Top performing money managers, savvy investors and institutional asset managers are relying on them.
One of them is the Smart Money Flow Index for instance. WallStreetCourier is the official provider of the SMFI for Bloomberg Professional. However, our members access the SMFI before it is sent to Bloomberg, giving them a head start in the market
Identify profitable trends before common price indicators do
Track down smart money positions
Analyzing the positions of the COT reports reveals valuable insights for a competitive edge.
Our research analyzes the investment behavior of Smart Money across three time frames, allowing you to identify high-rewarding market conditions and potential shifts before common price indicators do.