A timeless saying on Wall Street for good reason. Trend following stands as one of the oldest and most profitable investment strategies, supported by practitioner results and robust academic literature.
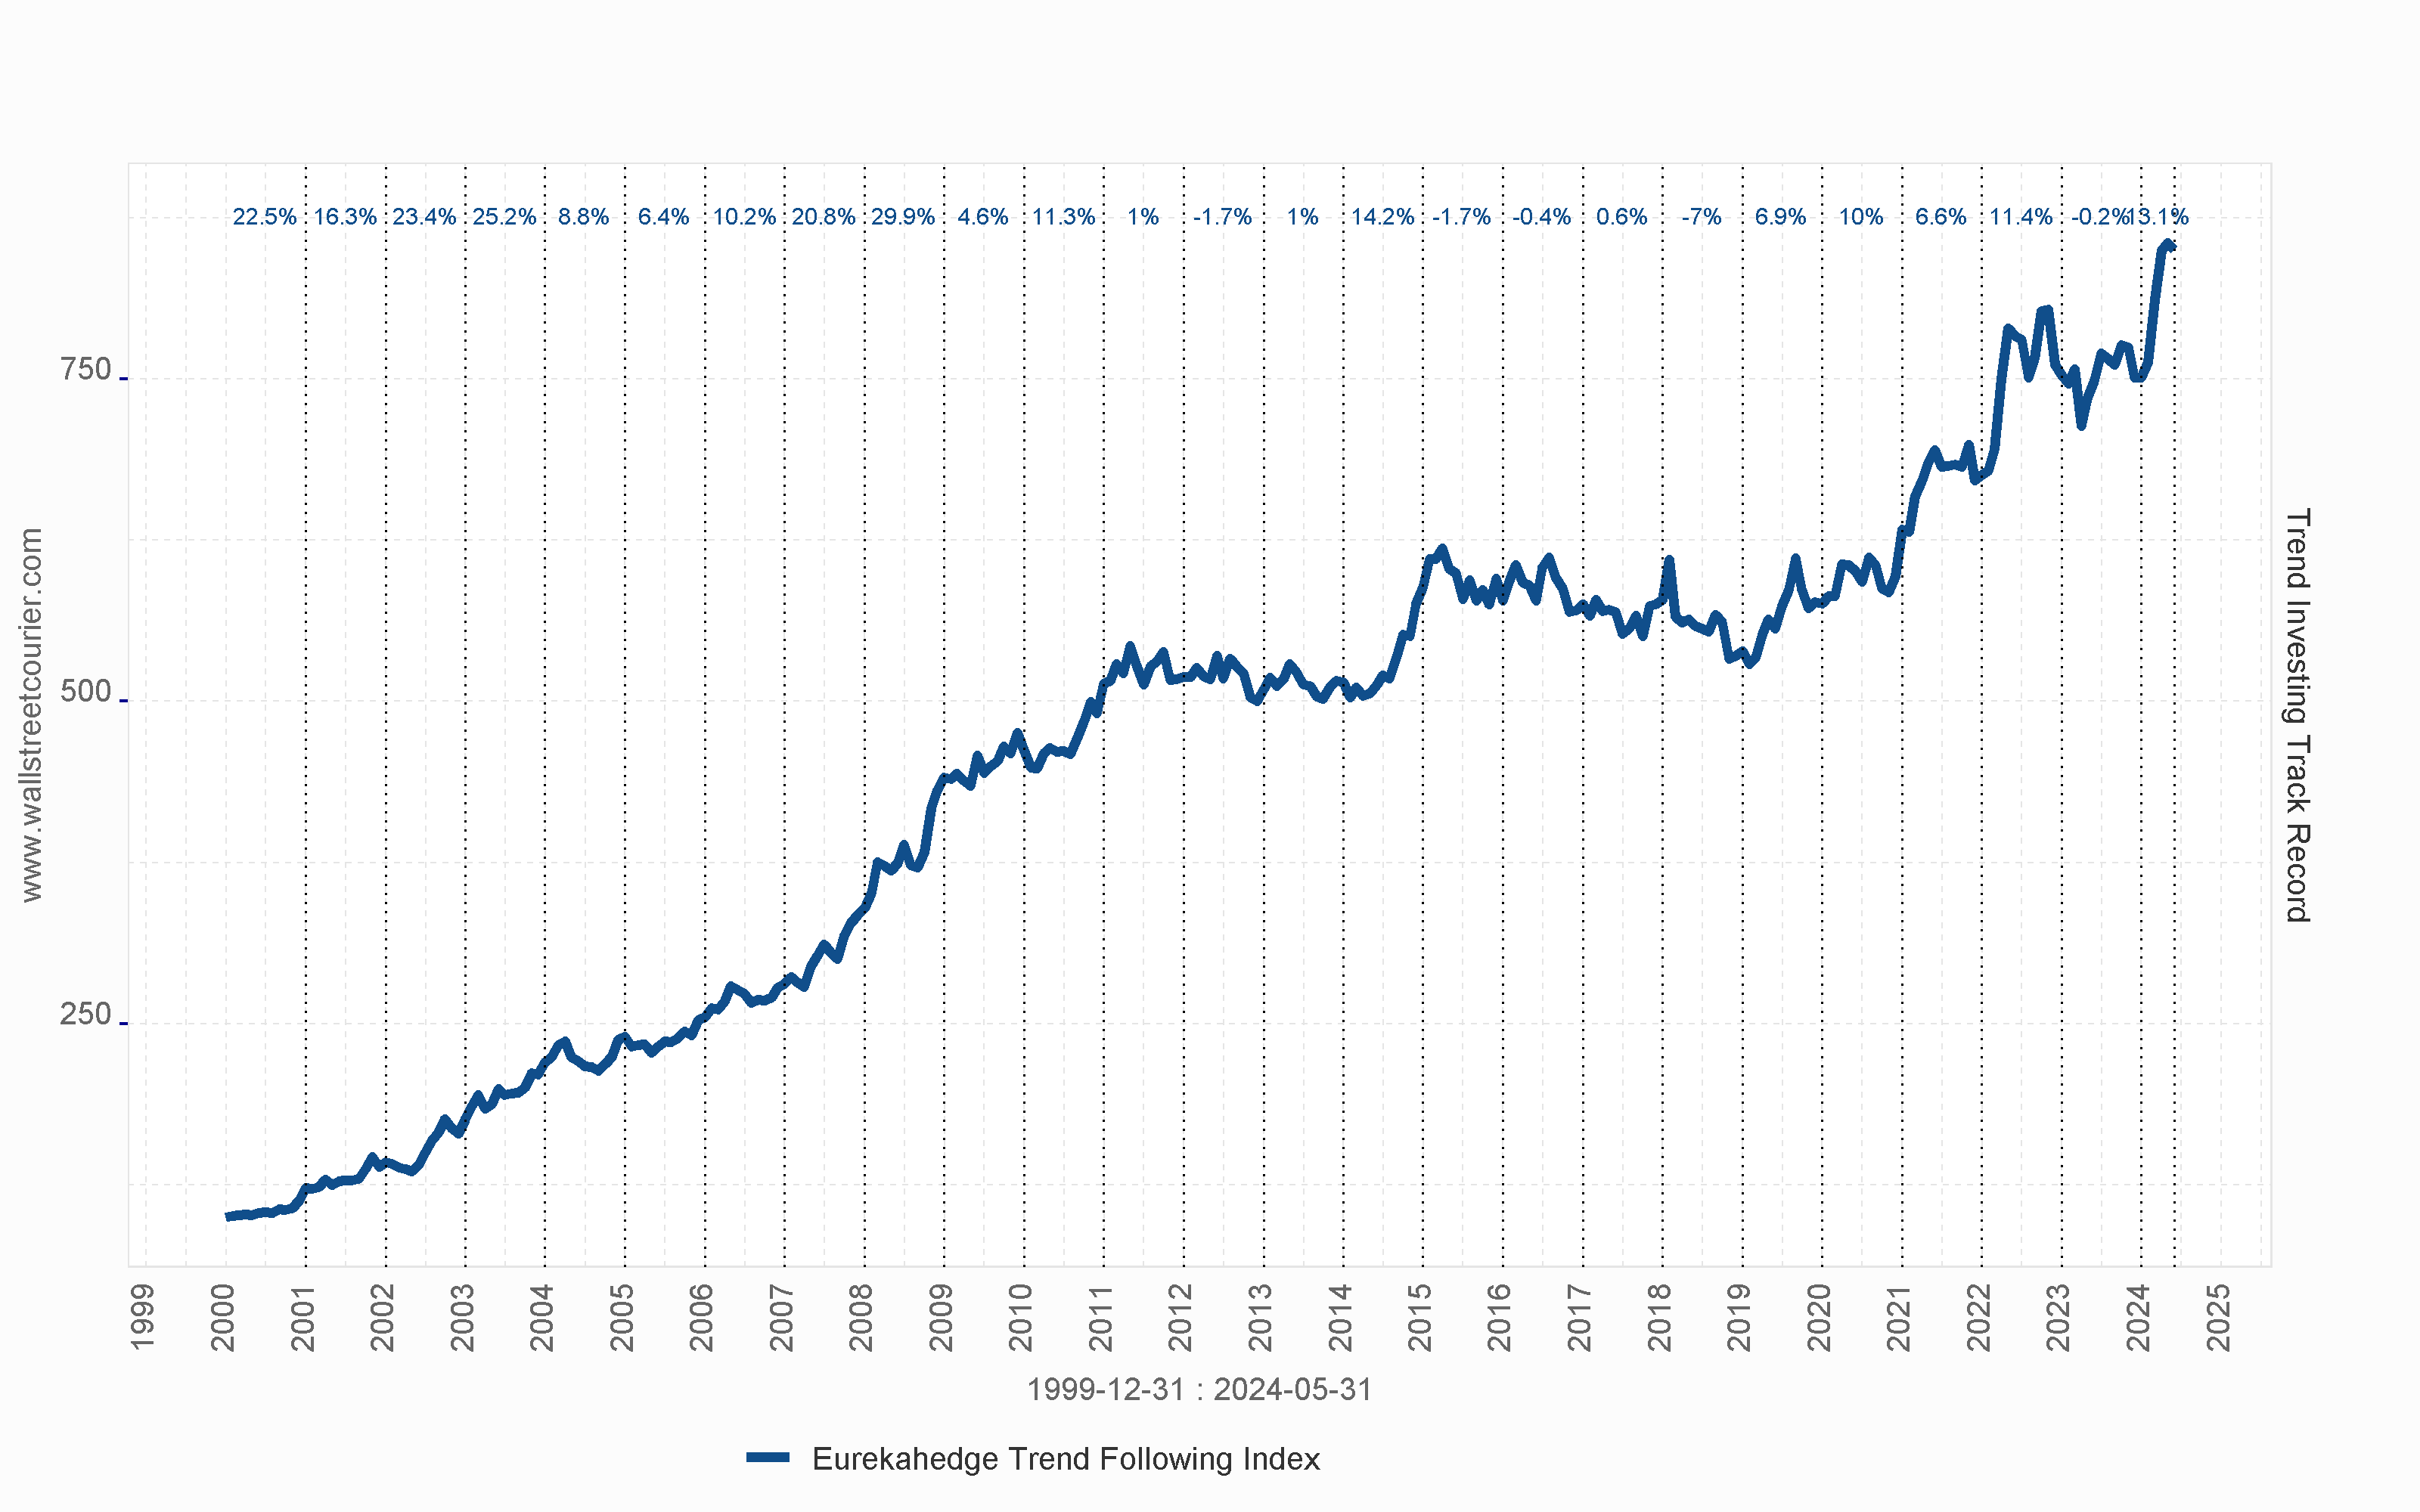
The Eurekahedge Trend Following Index (Bloomberg Ticker – EHFI808) is an equally weighted index of 34 constituent funds. The index is designed to provide a broad measure of the performance of underlying hedge fund managers who invest with a trend following strategy for institutional clients only.
Trend investing offers several compelling benefits, making it an attractive option for all investors:
While highly effective, trend following faces challenges:
Our platfrom provides you with unique tools and services to trend following that effectively addresses these challenges:
Effective Indicators: Utilize our wide range of carefully selected and rigorously tested indicators to accurately measure trends. With our 360-degree analysis, you’ll cover popular, proprietary, sentiment, and smart– and dumb-money indicators, effectively reducing market noise and minimizing whipsaw movements.
Current Trend Factors Analysis: Systematically aggregate indicators by type and timeframe to capture critical factors like trend, trend quality (aka market breadth), and sentiment. This gives you a clear and comprehensive understanding of prevailing market trends.
Monitoring Trend Conditions Over Time: Gauge trend strength and direction by consolidating essential trend factors into Short-, Mid-, and Long-Term Market Health Indicators. These signals can alert you to trend changes before they appear in market prices, providing a critical edge in timely decision-making.
Classifying Trends into Market Regimes: Categorize trends into six predefined market regimes based on their strength and direction. This helps you identify strong trends and attractive trading opportunities. Short-term regimes are ideal for tactical traders, while long-term regimes suit buy-and-hold investors.
User-Friendly Tools: Benefit from our platform’s intuitive dashboards and insightful analytics, designed for both novice and experienced investors. Easily pinpoint trends across global markets and seize profitable opportunities with confidence.
Join WallStreetCourier today and gain access to the essential tools and insights for mastering trend investing. Whether you’re a novice or an experienced investor, our platform empowers you to identify strong market trends, seize profitable opportunities, and navigate market fluctuations with confidence.
You are currently viewing a placeholder content from X. To access the actual content, click the button below. Please note that doing so will share data with third-party providers.
More Information