Most investors try to predict price. Professionals don't. They read regime.
How to identify the structural condition of any market, and position accordingly.
Market Regime Explained: Quick Summary
Most investors fail because they focus on price instead of structure. They ask whether the market will go up or down. Professionals ask a different question: what is the current structural condition of this market, and what has it historically implied for returns?
That question has a measurable answer. WallStreetCourier has tracked market regimes across 29 global markets since 1999. The Smart Money Flow Index, a core component of the framework, has been an official data series on Bloomberg Professional Terminal since 2003. This represents institutional-grade verification, a distinction held by only a small number of independent research providers worldwide. The data is unambiguous: regime determines return distribution far more reliably than price level alone.
In the S&P 500, the Very High Reward regime has produced +24.9% annualized since 1985 across 390 documented occurrences. The Very High Risk regime: −29.2% annualized. The Nasdaq 100 shows an even wider gap: +46.9% versus −43.2%. One index. Different regime. The difference is the entire framework.
The core insight: structure and context determine risk, not price level. A market at all-time highs with deteriorating internals is structurally different from a market at all-time highs with broad participation and institutional buying. Both look identical on a price chart. They are not the same regime, and they do not produce the same returns.
A market regime is a persistent market state defined by the interaction of trend, breadth, and sentiment, with distinct and measurable risk/return characteristics. Market regimes persist, transition in predictable patterns, and repeat across market cycle phases with enough consistency to be identified, classified, and acted upon. The framework is not backtested. It is observed across decades of live market data, refined through 25 years of daily application across 29 global markets.
The key distinction from traditional technical analysis is aggregation. A single indicator such as the 200-day moving average tells you something about the current market environment. A regime classification synthesizes dozens of indicators across trend, breadth, and sentiment into a single, coherent assessment of market health. The result is a structural picture that price alone cannot provide.
In quantitative finance, regime models formalize what experienced traders have long observed: markets behave differently in different environments. Bull market cycle phases have distinguishable internal characteristics. Bear markets have their own. The transitions between them follow patterns that can be measured, classified, and acted upon.
Regime analysis does not predict where prices will go. It assesses where conditions currently stand, and documents what returns have looked like historically when market conditions matched this structural profile. This is not forecasting. It is structured risk assessment based on repeatable evidence.
Any robust market regime framework must measure three distinct dimensions of market health. Price trend alone is insufficient.
Pillar 1: Trend. Trend indicators measure the current direction and momentum of price movement. Common inputs include exponential moving averages, MACD variants, and price momentum oscillators. Trend signals are necessary but not sufficient. A rising price trend driven by three mega-cap stocks behaves very differently from a rising trend driven by 80% of the index. This is where breadth becomes critical.
Pillar 2: Trend Quality (Market Breadth). Trend quality measures how broadly the trend is supported across the underlying market. A high-quality trend is one where the majority of stocks participate: New Highs significantly outnumber New Lows, a high percentage of stocks trade above their 50 and 200-day moving averages, and advancing volume consistently outpaces declining volume. A low-quality trend driven by a narrow group of large-cap names is statistically more fragile.
Pillar 3: Sentiment. Sentiment measures the balance of greed and fear in the market, and critically distinguishes between smart money and dumb money positioning. Among sentiment indicators, the Smart Money Flow Index (SMFI) plays a central role. Developed by Rudolf Koch Senior and listed as an official data series on Bloomberg Professional Terminal since 2003, the SMFI tracks institutional capital flows in a way that tends to lead price action rather than follow it. For a full breakdown, see the dedicated SMFI guide.
Individual indicators are noisy. Any single signal can flash false positives or lag behind price action. The solution is systematic aggregation: combining signals from across all three pillars into a unified Market Health Score.
The Market Health Score expresses, as a percentage, the proportion of indicators signaling positively for a given market across short-, mid-, and long-term timeframes:
Three separate scores are calculated (Short-Term, Mid-Term, and Long-Term Market Health), reflecting the different signal persistence of trend, breadth, and sentiment indicators across horizons. These three scores are then used to classify the market into its current regime.
A market can be short-term oversold while the mid- and long-term structure remains intact. This is characteristic of a healthy breather within a bull market cycle, not a bear market signal. Without multi-timeframe analysis, these market conditions are systematically misread.
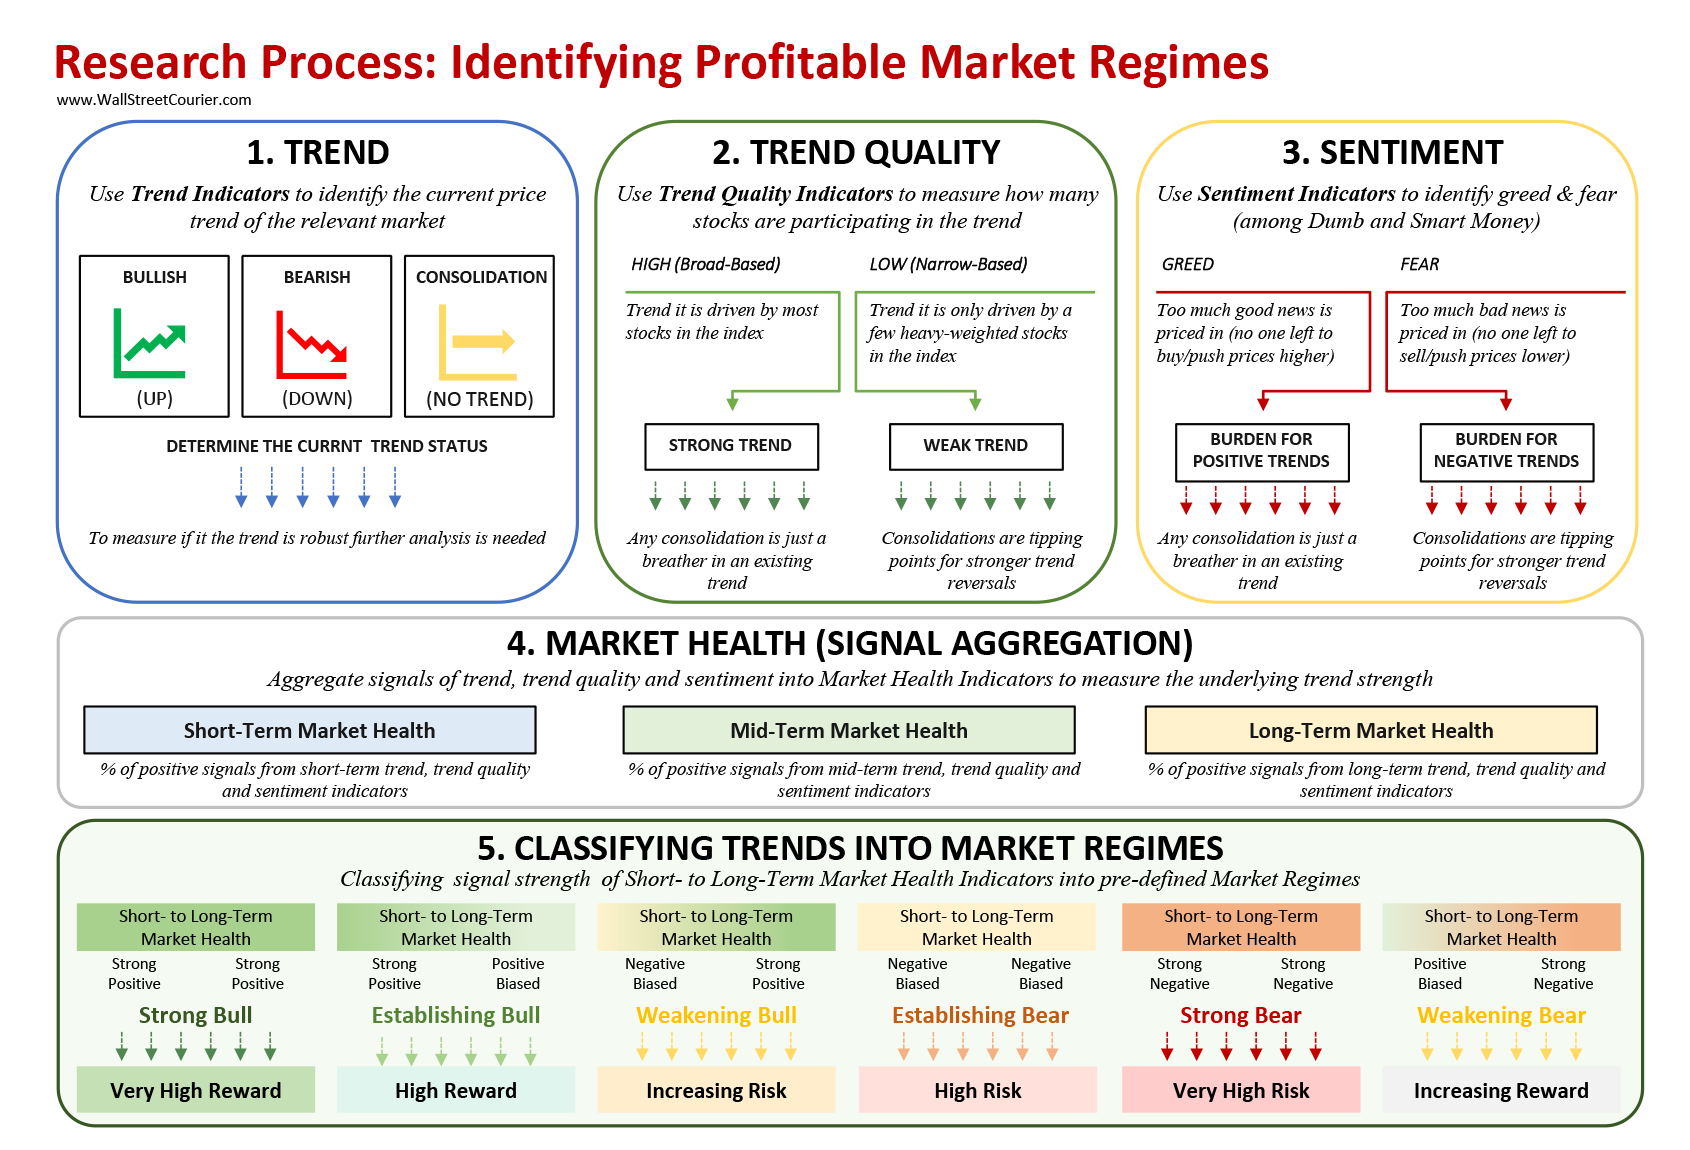
The WSC Research Process: From trend, breadth, and sentiment indicators to Market Health aggregation to regime classification. Source: WallStreetCourier.com
See the current Market Health Score for the S&P 500 and 28 other markets. Daily since 1999.
Register Free, No Credit CardWhen Short-Term, Mid-Term, and Long-Term Market Health scores are combined, markets classify into one of six distinct regimes. Each regime has a specific risk/return profile with statistically documented characteristics across 29 global markets since 1999.
| Market Regime | Market State | Ann. Return (S&P 500) | Up Days | Action Signal |
|---|---|---|---|---|
| Very High Reward | Strong Bull | +24.9% | 58.5% | Increase position / Stay long |
| High Reward | Establishing Bull | +25.0% | 62.3% | Start building position |
| Increasing Reward | Weakening Bear | +28.4% | 59.5% | Cautious accumulation |
| Increasing Risk | Weakening Bull | −12.5% | 41.4% | Take Profits / Reduce Risk |
| High Risk | Establishing Bear | −10.8% | 43.3% | Place Stop Loss / Exit |
| Very High Risk | Strong Bear | −29.2% | 44.2% | Do Not Buy Even If It Looks Cheap |
S&P 500, Short-Term regime, 1985–2026. Annualized returns across 390 Very High Reward occurrences and 158 Very High Risk occurrences. See where the S&P 500 stands today in the current S&P 500 market analysis, updated daily.
The six regimes are not arbitrary categories. They reflect the logical combinations of short-to-long-term market health signals. Very High Reward and High Reward regimes occur when both short- and long-term conditions are strongly or predominantly positive. Increasing Reward is a transitional regime: short-term conditions are improving while the long-term structure is still rebuilding. Increasing Risk is the mirror image: a still-positive long-term structure is being tested by deteriorating short-term conditions. High Risk and Very High Risk regimes are characterized by broadly negative conditions across timeframes.
WallStreetCourier has applied this framework across 29 global markets since 1999, generating one of the longest live track records in systematic retail market research. The approach is built on three operational layers.
Each trading day, indicators across trend, trend quality, and sentiment categories are updated for all covered markets. This includes the WSC Short-Term Trend Index and the Smart Money Flow Index (SMFI), an officially listed data series on Bloomberg Professional Terminal since 2003. The Indicator Dashboard presents all signals in a color-coded heatmap, allowing rapid assessment of where conditions are strengthening or deteriorating.
Individual indicator signals are aggregated into Short-Term, Mid-Term, and Long-Term Market Health scores for each market. These scores are visualized in the Daily Morning Briefing and the Daily Big Picture, a regime map scatterplot plotting all 29 covered markets simultaneously by their short-to-mid-term versus mid-to-long-term health coordinates.
Market Health scores are classified into the six regime zones, generating clear action signals for each market. The Daily Morning Briefing is published each morning for all covered markets. The Short-Term Regime Report provides a deeper view, breaking down both Short-Term and Long-Term Market Health scores in full detail and showing the underlying individual indicators behind each classification.
The WSC Market Regime classification draws on three categories of indicators, each measuring a distinct dimension of market health. The same process and indicator definitions are applied consistently across all covered markets, making regime comparisons across regions and market cycles meaningful rather than subjective.
Trend Indicators establish the directional foundation of the risk regime. Key inputs include exponential moving averages (EMA 50), modified MACD, price position relative to the 50-day EMA, and the WSC Short-Term Trend Index. A confirmed uptrend across all three timeframes is a necessary but not sufficient condition for a high-reward regime.
Market Breadth Indicators measure participation quality. Key inputs include the percentage of stocks above their 20, 50, 100, and 200-day moving averages; New Highs vs. New Lows; Advance/Decline ratios; the Modified McClellan Oscillator; and volume flow measures. Breadth deterioration before price deterioration remains one of the most reliable early-warning patterns in the framework.
Sentiment Indicators identify the balance of greed and fear across both retail and institutional participants. Retail sentiment: AAII Bulls/Bears Survey, CBOE Put/Call Ratio, RSI extremes. Institutional sentiment: the Smart Money Flow Index (SMFI). For a full breakdown of the SMFI methodology, see the dedicated SMFI guide.
See the current regime classification for the S&P 500 and 28 other markets. Daily since 1999. Bloomberg-verified since 2003.
Register Free, No Credit CardMost market research is US-centric. WallStreetCourier's Market Regime framework covers 29 markets across North America, Europe, Asia-Pacific, and Emerging Markets, including 12 US sectors. Regime analysis across 29 markets simultaneously reveals global rotation patterns that are invisible when looking at a single index. When European markets are in Very High Reward regimes while US markets are transitioning to Increasing Risk, that divergence carries positioning implications that a single-market view misses entirely.
The Daily Big Picture regime map scatterplot visualizes all covered markets simultaneously, plotting each market's short-to-mid-term health on the Y-axis against its mid-to-long-term health on the X-axis. This single visual provides an immediate global regime overview that would otherwise require hours of individual market analysis.
The Nasdaq 100 cycle of 2024 to 2025 is one of the most instructive examples in the framework history, because it illustrates precisely what regime analysis is built for: identifying structural deterioration before it becomes visible in price.
The Nasdaq 100 entered the period in a Very High Reward regime. Price was near all-time highs. Headlines were broadly constructive. Nothing in the price chart suggested a change in conditions. From January 2025, Short-Term Market Health began deteriorating while price remained elevated. Both Short-Term and Mid-Term health panels shifted from positive to negative territory, weeks before the price decline became apparent. Investors monitoring regime had a clear signal. Investors monitoring only price had none.
As both Short-Term and Mid-Term Market Health continued to deteriorate, the regime moved through High Risk and into Very High Risk territory. The Nasdaq 100 declined roughly 20% from its peak. The April 2025 Liberation Day tariff announcement accelerated the selloff. A significant number of investors who had held through the initial decline sold at or near the lows. But the risk regime had already peaked. Structural environments change before prices fully reflect them.
As Short-Term Market Health recovered and breadth indicators improved, the regime transitioned through Increasing Reward and back into Very High Reward by mid-2025. The Nasdaq 100 recovered to new all-time highs. As Short-Term Market Health recovered and breadth indicators improved, the regime transitioned through Increasing Reward and back into Very High Reward by mid-2025. The Nasdaq 100 surged to new all-time highs. Investors who acted on the Increasing Reward signal re-entered at significantly lower levels, while the narrativ remained overwhelmingly negative. The framework signal came from the data, not the headlines. The same pattern played out during the COVID shock of 2020 and the 2022 bear market cycle.

Figure 1: Nasdaq 100 Short- and Mid-Term Market Health (Aug 2024 to Oct 2025). Short-Term Health deteriorates below the 50% threshold from January 2025 while price remains elevated. Source: WallStreetCourier.com
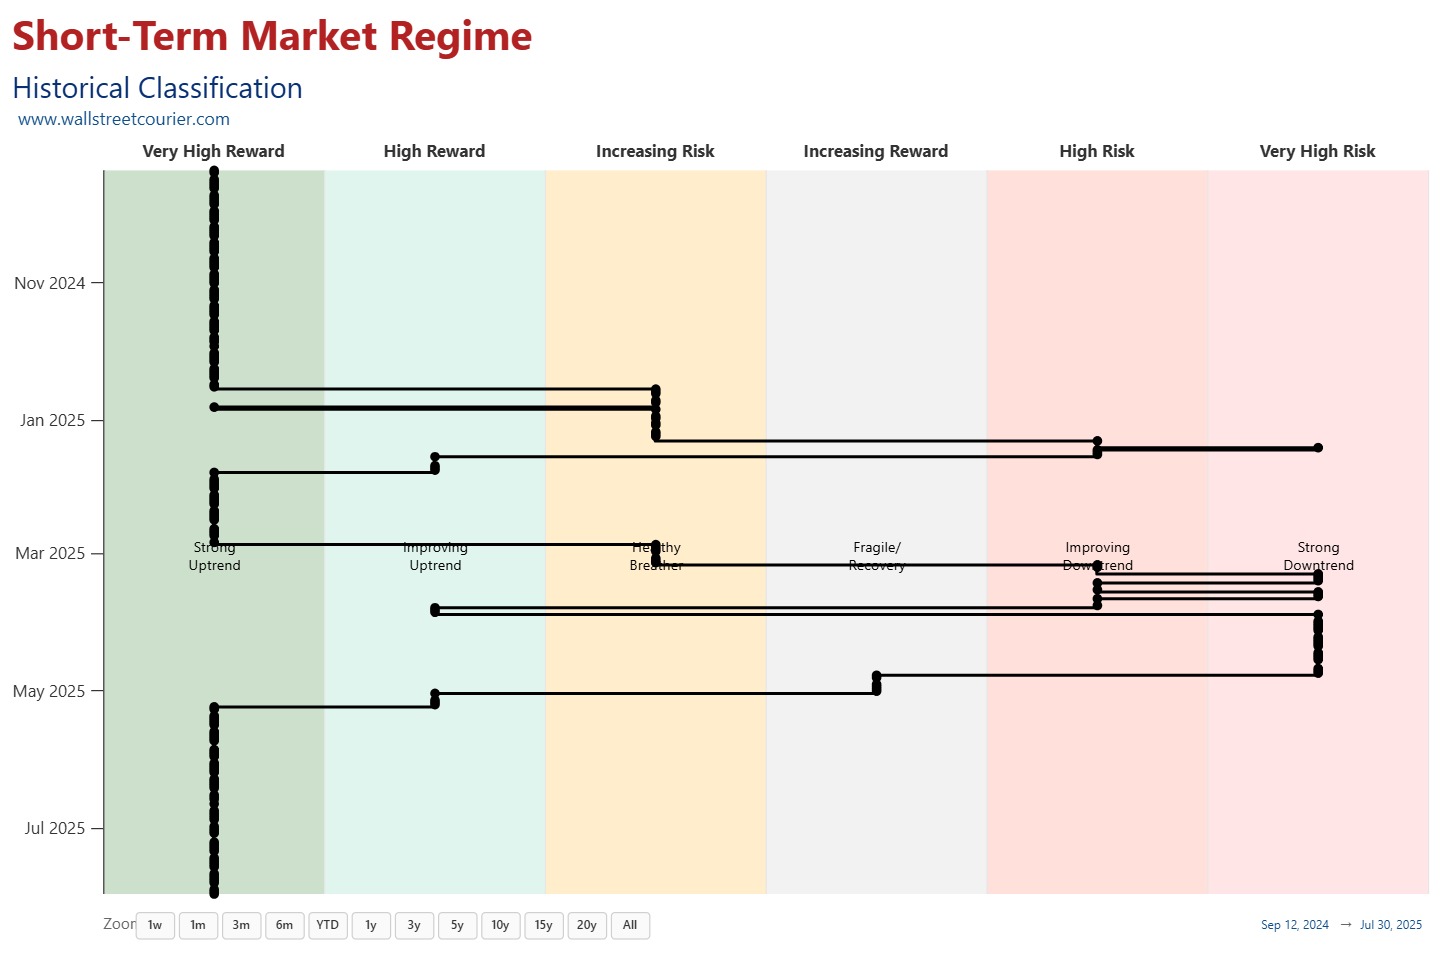
Figure 2: Nasdaq 100 Historical Market Regime Classification (Aug 2024 to Oct 2025). The path from Very High Reward through Very High Risk and back to Very High Reward illustrates the complete cycle. Source: WallStreetCourier.com
Regime identification is only useful if it translates into clear investment behavior. The framework is not designed to generate trading signals in isolation. It is designed to structure the decision process across the full market cycle.
Historical evidence supports full equity exposure. Stay invested, increase position size where suitable, and buy dips as they occur. Reducing exposure in these regimes means leaving statistically supported upside on the table.
Long-term structure intact but short-term conditions deteriorating. Stop adding exposure, monitor positions closely, place stop losses where appropriate. The majority of large drawdowns begin with a transition through Increasing Risk.
Statistical probability shifts decisively against equity exposure. S&P 500 Very High Risk: −29.2% annualized across 158 occurrences since 1985. The framework is explicit: do not buy even if it looks cheap.
Short-term conditions improving while long-term structure is still rebuilding. Begin systematic re-entry with partial positions. Investors who wait for full Very High Reward confirmation consistently buy at higher prices than those who act on the first Increasing Reward signal.
Daily regime classifications across 29 global markets, built on a framework with one of the longest live track records in independent market research and an official Bloomberg Professional Terminal listing since 2003. One market per week free, no credit card required.
Market regime analysis represents a fundamental shift in how investors relate to market information. Rather than processing an endless stream of narratives, regime analysis asks a single structured question: what does the weight of technical evidence say about current market health, and what does that imply for risk-adjusted positioning?
The framework does not eliminate uncertainty. No analytical system can. What it does is convert uncertainty into structured probability, replacing gut-feel reactions to news with systematic assessments of conditions that have documented historical behavior across 29 markets and more than 25 years of live operation.
Discipline over Conviction. Structure over Narrative. Risk Management over Prediction. This is not a slogan. It is the operational logic of regime-based market analysis.
You are currently viewing a placeholder content from X. To access the actual content, click the button below. Please note that doing so will share data with third-party providers.
More Information