S&P 500 Outlook: Analyzing the Current Market Regime of S&P 500 (SPX)

Market Regime Newsletter

A quick glimpse into our market research

Sample Research

Here’s a sample of our Market Regime Newsletter, where we analyze specific markets using our precise approach. This showcases our consistent research and enables users to efficiently apply our indicators and tools to any market.

Key Points:

This Market Regime Newsletter was issued on September 29th, 2024

  • The S&P 500 (SPX) reached a new all-time high, closing at 5767.
  • Fundamental analysts argued that the Federal Reserve’s recent rate cuts offered strong support, but rising unemployment or declining earnings could potentially threaten the rally.
  • Despite potential ongoing macroeconomic challenges, our data still suggests a promising outlook, a view unchanged since November 2023.
  • This outlook is supported by the robust ‘Very High Reward’ market regime for both short-term and long-term perspectives, indicating a strong uptrend, backed by high trend quality and supportive smart money positions.

Current Market Regime of the S&P 500 Index

Description of the current Market Regime for the S&P 500 Index

The S&P 500 is currently in a Very High Reward Market Regime across both the short- and long-term perspectives. This regime is characterized by a robust uptrend in both timeframes, supported by significantly low volatility. Prices consistently trend upwards, bolstered by a broad range of well-performing stocks. Even amid negative news, the market shows notable resilience due to the strength of its positive trend. Short-term declines are typically brief and driven by sentiment or overbought conditions, positioning the market well for continued gains.

Driving Forces Behind the Current Market Regime:

Our research categorizes the market into six predefined market regimes based on trend strength and direction. To analyze these forces, we use dozens of indicator signals covering essential performance factors such as trend, trend quality, sentiment, and the positions of smart and dumb money. These indicators are consolidated into Market Health Indicators, measuring signal positivity across different timeframes for an unbiased trend analysis. Scores on a 0 to 100% scale indicate signal positivity among these indicators. Values below 50% indicate a negative outlook, while those above 50% signal a positive outlook.

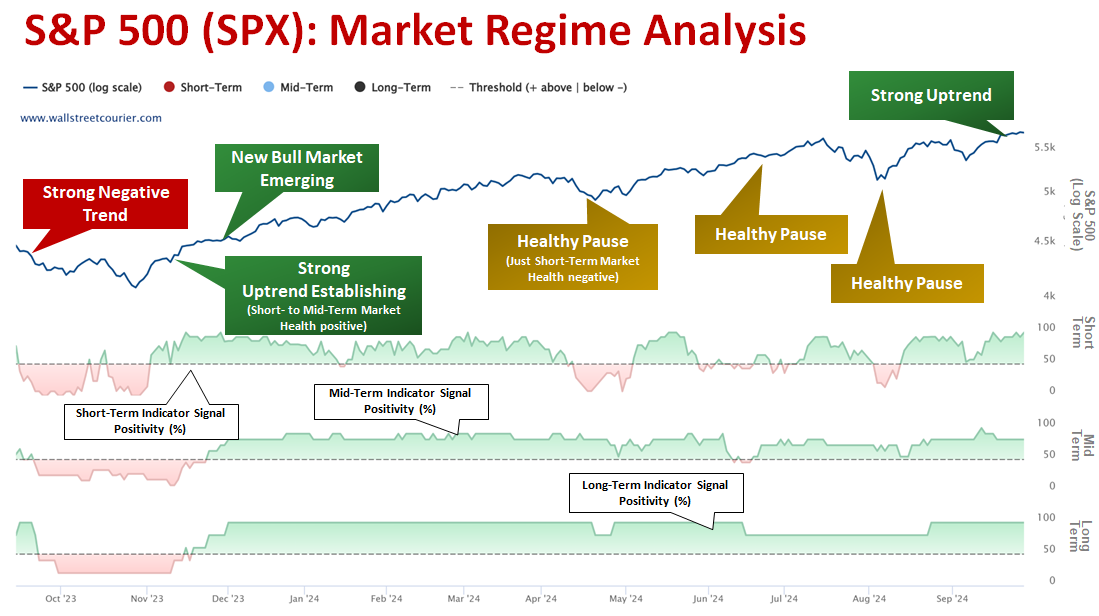
The chart below illustrates the S&P 500 Index (SPX) in the first panel, followed by three subsequent panels detailing Short-, Mid-, and Long-Term Market Health trends over time.

The current bull market, which took off in late November 2023, was driven by a sharp rise in Short-Term Market Strength, nearing 100%, alongside a solid rebound in Mid- to Long-Term Market Indicators. These signals often suggest a strong uptrend emerging after a period of significant declines. Investors may find opportunities to enter positions while awaiting further improvement in Mid- to Long-Term conditions, which soon followed. It’s important to recognize that during such phases, market sentiment is often characterized by caution, with many hesitant to engage in the rally. For this reason, a disciplined and methodical investment approach is key to taking advantage of these opportunities. Since that point, the S&P 500 has surged by over 36%.

Beyond identifying clear upward and downward trends, our Market Health Indicators provide valuable insight into distinguishing between stable consolidation phases and potential corrections. This distinction is particularly advantageous, as consolidation periods often represent critical junctures. They can either set the stage for continued gains or signal the onset of significant declines. As a result, making strategic decisions – whether to lock in profits, take advantage of dips, exit positions, or consider shorting the market – becomes especially complex during these times.

How to spot high-reward & low risk market opportunities

3 Steps for Determining Market Regimes

With our structured approach, we can identify the respective market regime for any market. Our methodology include the following steps:

1

Identify Robust Trends

  • Trends are measured through a systematic screening of signals from multiple indicators (for example the WSC Trend Index, the Smart Money Flow Index or the Daily Put-/Call Ratio All CBOE Options)
  • These indicators cover various categories (trend, trend quality, and sentiment, including dumb- and smart-money positioning) and timeframes.
  • This diversified approach minimizes the impact of noise in individual indicators and enables an unbiased and robust view of current market conditions.
2

Monitor Market Health

  • These indicators are representing composites of these signals for three different timeframes.
  • Scores on a 0 to 100% scale denote signal positivity.
  • Values below 50% indicate a negative outlook, while those above 50% signal positive market health.
  • The combination of these health indicators results in market regimes, indicating the strength of the current trend for a specific timeframe.

3

Determine Market Regimes

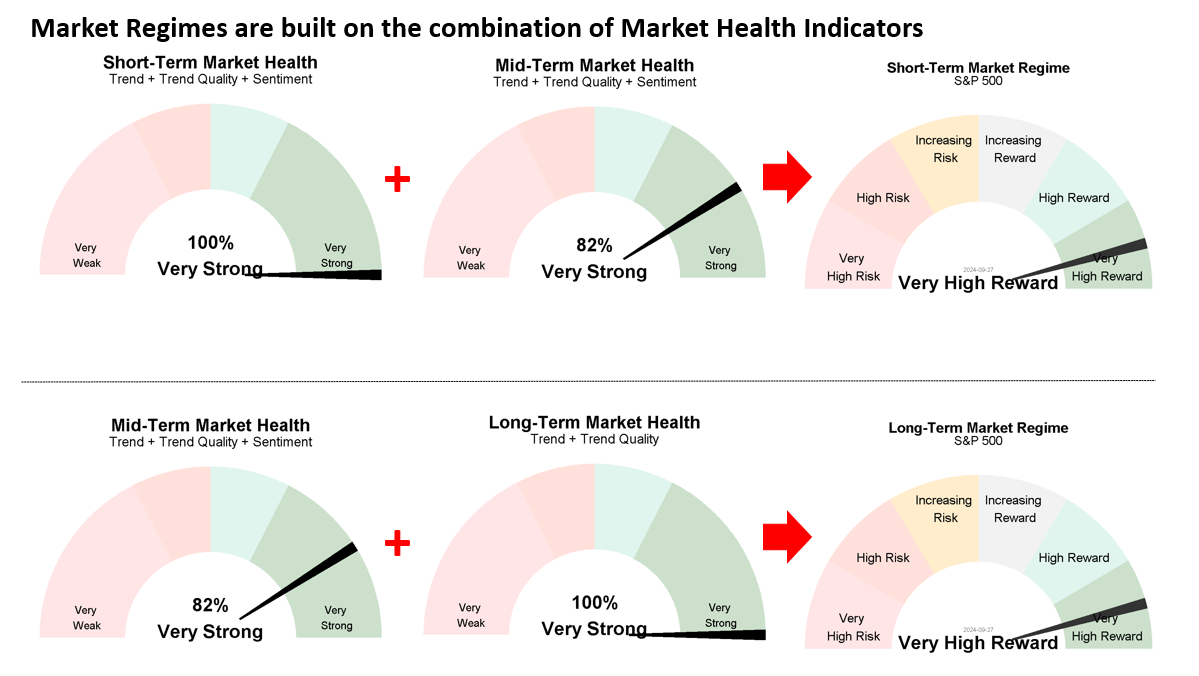
  • By combining short- to mid-term and mid-term to long-term market health readings, the specific market regime is determined.
  • These Market Regime gauges help identify market regimes and shifts without the hassle of going through all indicator signals.
  • To be more precise, the Tactical Short-Term Market Regime is constructed upon the combination of short- to mid-term market health, while the Strategic Long-Term Market Regime is based on the amalgamation of mid- to long-term market health.

As illustrated in the chart above, this bull run experienced four temporary pauses within the ongoing uptrend. The first occurred in mid-January and was relatively short-lived. The second was more pronounced, with the S&P 500 declining nearly 7% between early and mid-April. This was followed by a brief consolidation phase in June and a more significant dip in early August. It’s worth noting that, in each instance, the financial media was quick to speculate about an impending bear market. As a result, identifying opportunities during these healthy consolidation periods proved challenging without the right indicators.

Periods of healthy consolidation are typically marked by short-term indicators turning negative while longer-term market conditions remain strong. This pattern was evident several times this year, sometimes even before the S&P 500 encountered a notable short-term pullback, highlighting the value of our trend analysis approach. With Mid- to Long-Term Market Health remaining solid, this decline was simply a brief pause in the broader bull market, not the beginning of a significant downturn. Such insights are critical, particularly when negative media coverage can trigger undue investor anxiety.

From Market Health Indicators To Market Regimes

Currently, Short- to Long-Term Market Health readings indicate exceptional strength, ranging between 82% and 100%. This underscores the robust nature of the current uptrend in the S&P 500, driven by a majority of stocks in the index, healthy volume flows into the market, and expanding smart money positions. As long as we do not see a significant deterioration below 50% within Short- and Mid-Term Market Health, the outlook for the S&P 500 remains compelling.

These positive market environment is also reflected in our Market Regimes gauges above. By combining Short-Term to Mid-Term and Mid-Term to Long-Term Market Health readings, the specific market regime is determined. These Market Regime gauges simplify the identification of market regimes and shifts, eliminating the need to sift through individual indicator signals. Specifically, the Short-Term Market Regime is constructed based on the combination of Short-Term to Mid-Term Market Health, while the Long-Term Market Regime relies on the amalgamation of Mid-Term to Long-Term Market Health.

What the history tells us about the current Market Regimes

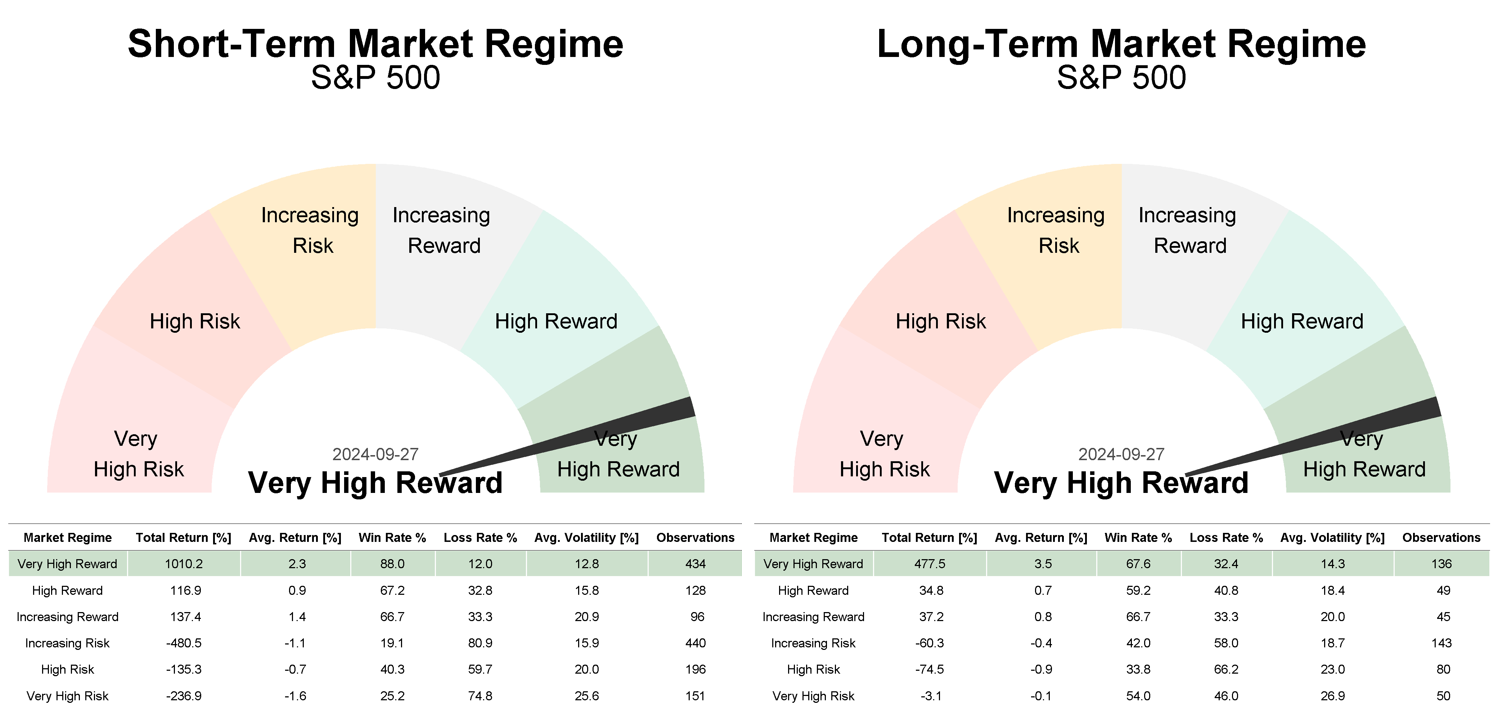
Since the availability of full market regime data dating back to 1985, the S&P 500 Index (SPX) has entered a ‘Very High Reward’ market regime 434 times from a short-term perspective and 136 times from a long-term perspective. These market regimes are characterized by Short- to Long-Term Market Health readings above 50%. Remarkably, in 88% of these instances, S&P 500 stocks yielded a total cumulative gain of 1010% when the short-term market regime was positive. The win ratio for the long-term positive market regime was slightly lower at 67%, but also had a total gain of 477%. Additionally, the average volatility within these regimes ranged between 12% and 14%, which is quite low.

The Bottom Line

  • The ‘Very High Reward’ market regime remains in place across both short- and long-term perspectives, making the outlook for the S&P 500 particularly attractive.
  • The uptrend is bolstered by a broad participation of stocks within the index, growing smart money involvement, and cautious investor sentiment influenced by negative macroeconomic developments – indicating that much of the bad news has likely been factored in.
  • These factors create a solid foundation for continued upward momentum.
  • Any potential dips in the near future are likely to be brief pauses rather than signs of a deeper correction, assuming Mid- to Long-Term Market Health stays strong.

Want our Market Regime Trend Analysis sent directly to your mailbox?

Market Regime Newsletter

In our Market Regime Newsletter, we provide analyses of specific markets using our approach to deliver precise outlooks. This showcases our consistent research approach and enables users to efficiently apply our indicators and tools to analyze any market.

Subscribe to our Market Regime Newsletter