Commitment of Traders Report: Quick Summary
The Commitment of Traders (CoT) Report is a weekly publication by the Commodity Futures Trading Commission (CFTC), the US regulatory authority for derivatives markets. It discloses the aggregate net futures and options positions of large market participants across all major US futures exchanges, including the CME, CBOT, NYMEX and COMEX.
Every entity holding futures positions above a certain reporting threshold is required by law to disclose those positions to the CFTC. The resulting report, published every Friday for positions as of the prior Tuesday, provides a rare and legally mandated window into the actual positioning of the largest market participants across commodities, currencies, interest rates and equity index futures.
Unlike sentiment surveys or price-derived indicators, the CoT Report reflects what participants are actually doing with capital, not what they say or what price implies. This makes it one of the most direct sources of positioning intelligence available to investors.
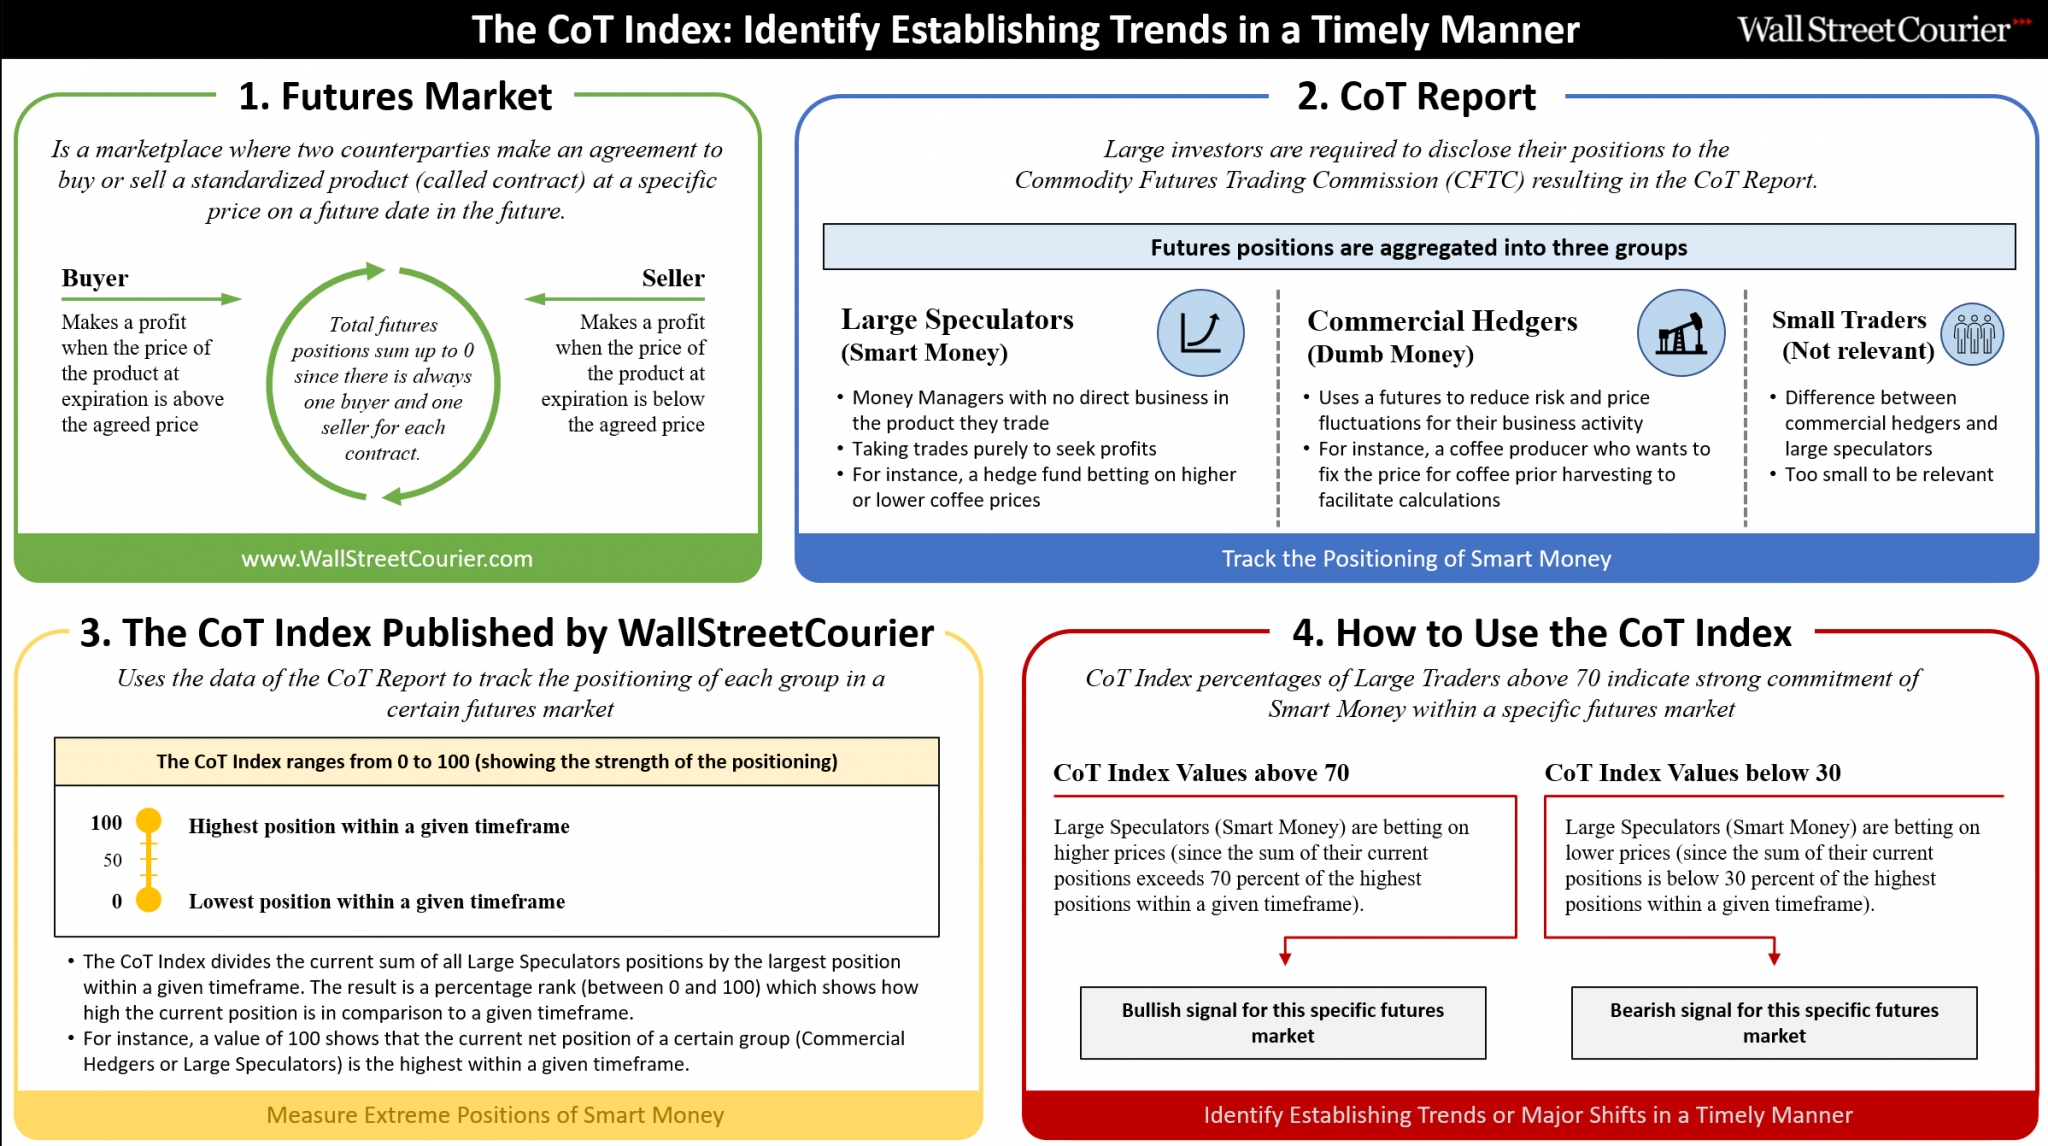
The CFTC separates futures market participants into three categories. Each group has distinct motivations, informational advantages and behavioral patterns that can be measured and analyzed over time.
Dumb Money in CoT context. Producers, processors and end-users who use futures to hedge operational exposure. Their positions reflect business risk management, not directional market views. They tend to be contrarian by necessity, hedging into strength and reducing hedges into weakness.
Dumb Money. Non-reportable positions held by smaller participants below the CFTC reporting threshold. This group tends to be trend-following and emotionally reactive, similar to retail equity investors. Their extreme positioning often marks turning points.
Smart Money. Hedge funds, managed money and large institutional traders with no commercial hedging requirement. Their positions reflect directional views backed by research and capital. They tend to be trend-leading, accumulating positions before major moves materialize in price.
This is not a generalization. It is a documented pattern confirmed across futures markets in peer-reviewed literature, including the Journal of Futures Markets (2001). Large Speculators consistently accumulate positions ahead of major price moves. Commercial Hedgers and Small Traders consistently do the opposite. The WSC CoT Index is built to track and quantify this divergence.
Raw CoT positioning data tells you what Smart Money is holding today. What it does not tell you is whether that position is extreme, normal or neutral relative to historical context. A net long position of 50,000 contracts means very different things in different markets and at different points in time.
The WSC CoT Index solves this by converting raw net positions into a normalized percentage scale. It measures where current Smart Money positioning stands relative to the full range of positions over a defined historical lookback period.
WallStreetCourier calculates the CoT Index across three timeframes, each capturing a different dimension of Smart Money positioning:
The CoT Index generates signals based on the position of Smart Money relative to its historical range. The five key scenarios:
| CoT Index (Smart Money) | Interpretation | Signal |
|---|---|---|
| Above 70% (all timeframes) | Smart Money at historically extreme long. Strong structural positioning in favor of the market. | Positive Regime |
| Rising from below 30% | Smart Money recovering from extreme short. Potential regime shift from negative to positive. Most actionable early signal. | Potential Shift |
| Falling from above 70% | Smart Money reducing extreme long. Distribution signal. Regime may be turning from positive to neutral. | Caution |
| Below 30% (all timeframes) | Smart Money at historically extreme short. Structural positioning against the market. | Negative Regime |
| 30-70% (all timeframes) | Smart Money in neutral zone. No directional positioning signal. Other indicators take precedence. | Neutral |
The most actionable signals come from extreme positions combined with a directional change: Smart Money moving from below 30% upward, or from above 70% downward. These transitions have historically preceded significant directional moves in the underlying futures market.
Access the WSC CoT Index for 38 futures markets, updated weekly.
Register Free, No Credit CardThe following charts illustrate how the WSC CoT Index identifies extreme Smart Money positioning and the regime shifts that follow. Each chart shows Smart Money net positions alongside the CoT Index and the underlying futures price.
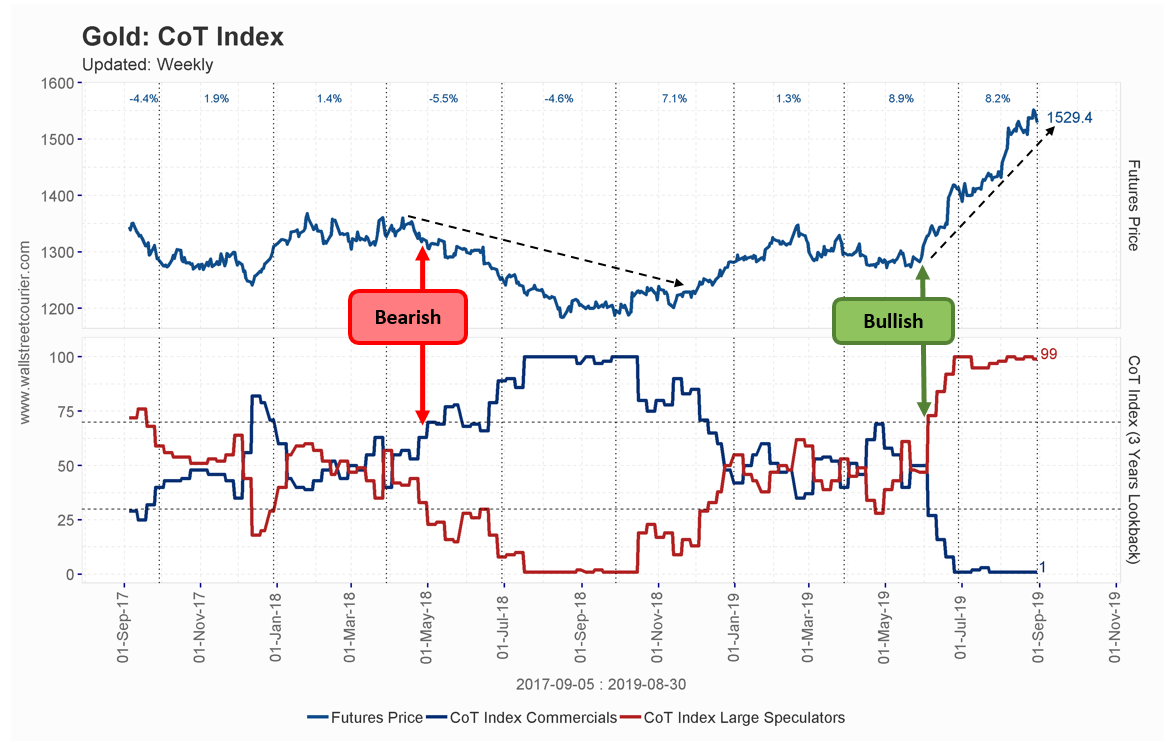
WSC CoT Index: Smart Money positioning identifies a positive regime signal. CoT Index above 70% confirms extreme long positioning ahead of the price move. Source: WallStreetCourier.com
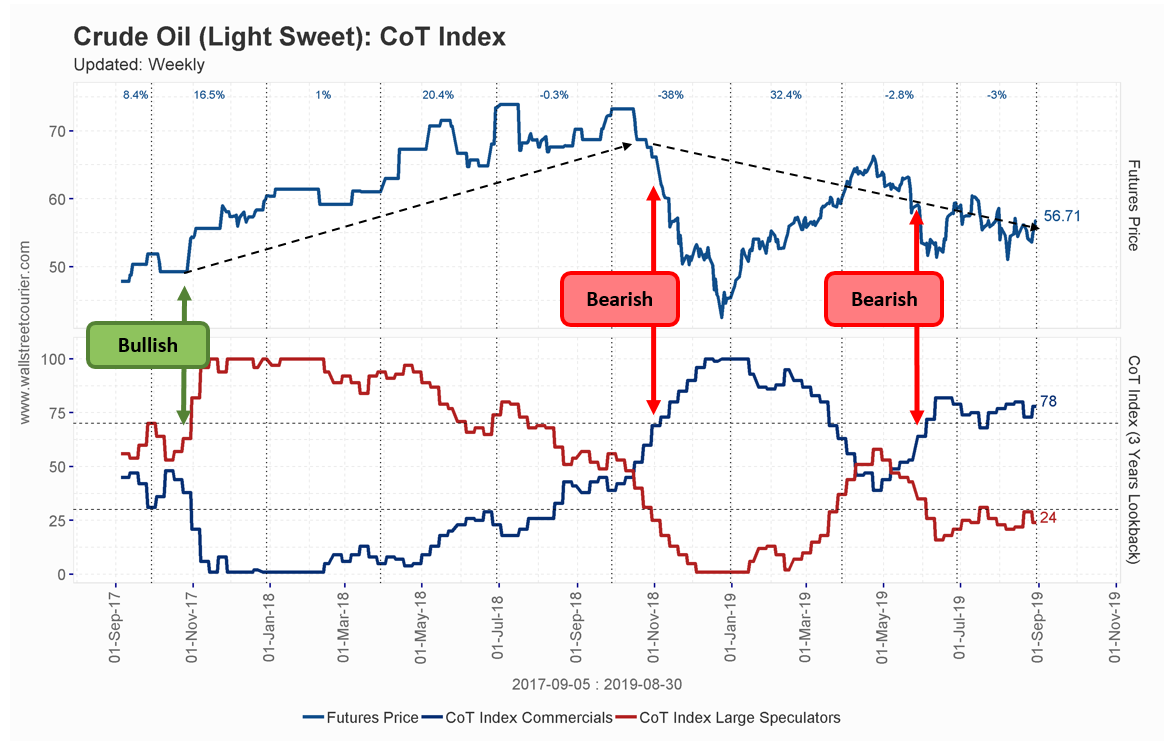
WSC CoT Index: Divergence between Smart Money positioning and price action precedes a significant market move. Source: WallStreetCourier.com
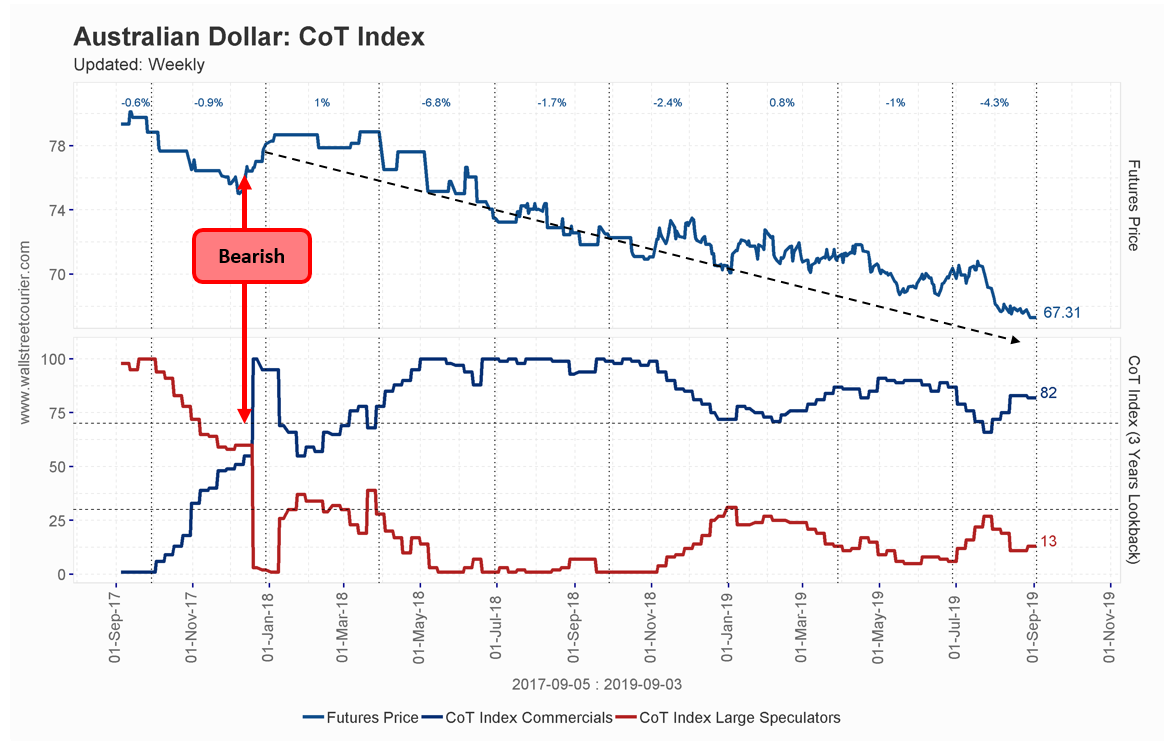
WSC CoT Index: CoT Index below 30% confirms extreme short positioning by Smart Money. Negative regime signal precedes price decline. Source: WallStreetCourier.com
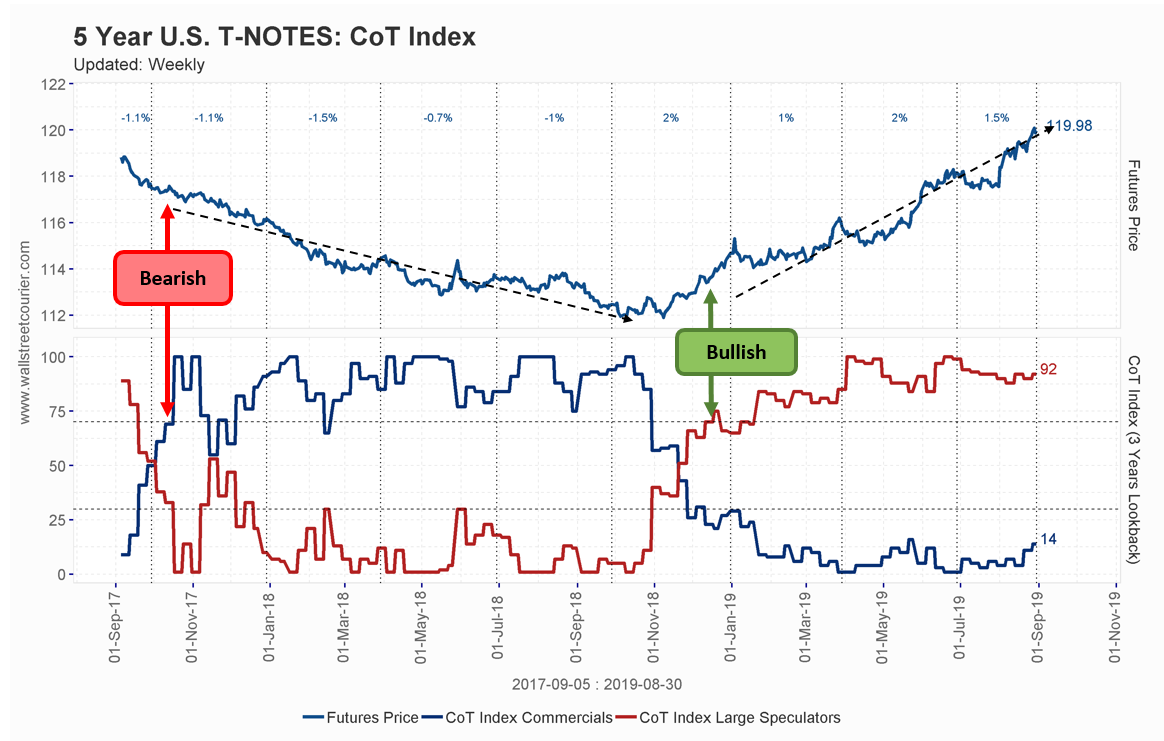
WSC CoT Index: Smart Money recovering from extreme short position generates a potential regime shift signal ahead of price recovery. Source: WallStreetCourier.com
Chart examples are illustrative of the CoT Index methodology. Past indicator performance does not guarantee future accuracy.
The CoT Report covers futures markets, not equity indices. But commodities and equity markets do not operate in isolation. Smart Money positioning in key commodity markets, such as crude oil, copper, agricultural commodities and gold, can provide valuable context for equity market analysis and portfolio positioning.
Commodity markets often reflect structural economic conditions before they appear in equity prices. Smart Money accumulation in industrial metals ahead of an economic acceleration, or distribution in energy markets ahead of a slowdown, are examples of cross-market signals that can inform portfolio decisions beyond the futures markets themselves.
CoT signals provide a systematic framework for accessing commodity and currency futures positioning, adding a dimension of market intelligence that equity-only frameworks cannot provide.
Smart Money positioning in related futures markets can confirm or contradict equity regime signals. Divergences between commodity Smart Money and equity market conditions often precede significant regime transitions.
Commodity futures markets can reflect structural economic shifts before they appear in equity prices. CoT positioning in key markets provides an additional layer of early-warning analysis.
The WSC CoT Index: A visual guide to identifying market regimes using Smart Money positioning. CoT Index values above 70% signal positive regimes. Values below 30% signal negative regimes. Source: WallStreetCourier.com
A downloadable version of the CoT Index methodology guide is available as a PDF: Download: The CoT Index , Identifying Establishing Trends
The CoT Regime Scoreboard aggregates Smart Money positioning signals across all 38 covered futures markets into a single, scannable overview. Each market is evaluated across short-, mid- and long-term Smart Money positioning, generating a proprietary momentum score and a current regime classification.
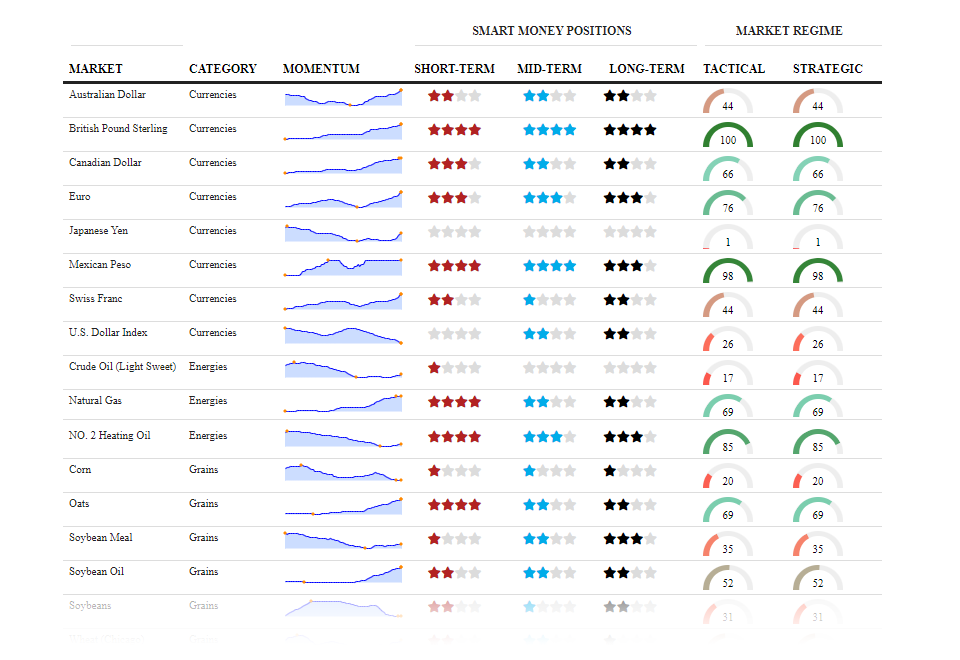
The WSC CoT Regime Scoreboard: Smart Money positioning, momentum score and regime classification across all covered futures markets. Updated weekly. Source: WallStreetCourier.com
Full Scoreboard access across 38 futures markets. Weekly update, every Friday.
View Plans, From $27.99/monthThe WSC CoT service covers 38 futures markets across six asset categories, all tracked via CFTC data. Each market has its own CoT Index time series updated weekly.
Both the CoT Report and the Smart Money Flow Index track institutional positioning, but they are fundamentally different tools that cover different markets and use different data sources.
| Dimension | WSC CoT Service | Smart Money Flow Index |
|---|---|---|
| Data source | CFTC mandatory position disclosures | Intraday DJIA price pattern analysis |
| Markets covered | 38 futures markets (commodities, currencies, rates, equity futures) | 11 major global equity indices |
| Update frequency | Weekly (Friday, positions as of Tuesday) | Daily (end-of-day) |
| What it measures | Actual futures positioning of reportable large traders | Institutional capital flow in equity markets via intraday behavior |
| Primary use | Futures market regime classification, portfolio diversification | Equity market sentiment, part of WSC Market Health Score |
| Bloomberg listing | No | Yes, since 2003 (SMART <Index> GO) |
Used together, the CoT service and the SMFI provide positioning intelligence across both futures and equity markets, covering the full spectrum of where informed capital is moving.
Weekly CoT Index across currencies, energies, metals, grains, softs, interest rates and equity futures. CoT Regime Scoreboard with momentum scoring. Updated every Friday following the CFTC release. From $27.99/month billed annually.
You are currently viewing a placeholder content from X. To access the actual content, click the button below. Please note that doing so will share data with third-party providers.
More Information