Trend following, a popular investment style, has been around for centuries. Back in the day, David Ricardo, an influential economist of the classical era, emphasized the importance of cutting losses and riding out profits, demonstrating his attention to trends. It’s fascinating to see how trend following has stood the test of time and continues to be a favored approach by many investors. The potential for substantial returns has undoubtedly contributed to the widespread popularity of trend following among investors.
The concept of trend following is relatively simple: buy an asset when it’s trending up and sell it when it’s trending down. The idea is to ride the trend for as long as it lasts, capturing as much of the gains as possible. Nevertheless, identifying and measuring trends can be a challenging endeavor.
Trend indicators are commonly used to identify trends, but it’s crucial to find the right balance between readability and the number of trades executed. Indicators that are too complex or slow can lead to missed opportunities or greater losses, while those that are too sensitive can lead to excessive trading and increased costs. Despite using various techniques to smooth and filter data or combining different indicators, finding the perfect balance remains a challenge for investors.
Some have likened the quest for the perfect trend indicator to the search for the holy grail of investing. The ideal indicator would swiftly identify sustainable trend reversals while ignoring market noise during the trend, minimizing the risk of entering or exiting too late, and reducing the number of trades. However, using price data to identify trends always will involve a trade-off between readability and stability. This is because a trend must develop before it can be reliably measured and acted upon. Therefore, relying solely on price data makes it impossible to avoid this trade-off and overcome this challenge.
WallStreetCourier provides a solution that effectively resolves the inherent trade-offs in trend indicators through its proprietary WSC Trend Index. Introduced nearly two decades ago, this groundbreaking trend indicator has emerged as the foremost choice among subscribers for accurately measuring the true trend of the S&P 500.
Unlike traditional price trend indicators, the WSC Trend Index utilizes a unique approach to calculate the momentum and number of stocks hitting daily new highs and lows within the S&P 500. It then aggregates this information to generate a highly accurate trend signal that captures the underlying trend of the S&P 500, free from the distorting effects of index arbitrage and heavy-weighted stocks in the index.
By focusing on individual stocks in the index, the WSC Trend Index is able to filter out market noise and identify sustainable trends and reversals on time, which provides greater stability for trend investors. This approach also allows the indicator to react even before a major trend reversal is visible in the S&P 500. This gives investors a competitive edge by allowing them to jump off the bandwagon at the right time and potentially save more of the trend as profit.
The WSC Trend Index has a proven track record of calling major turning points, making it a reliable and stable investment strategy. Investors who use this indicator can minimize the risk of being too late in or too late out of a trend, while also reducing the number of trades required. The WSC Trend Index is an essential tool for investors seeking a sophisticated trend indicator that delivers reliable and accurate signals to capitalize on strong market trends. With the WSC Trend Index, investors can make informed decisions based on bottom-up trend data, without sacrificing stability or profitability.
Historical data spanning from 1965 shows that the WSC Trend Index has been highly effective in identifying sustained trends. Specifically, when the index has registered readings above 60%, the S&P 500 generated an impressive, annualized return of 14.2%. In contrast, when the index has traded below 60%, the S&P 500 has produced a negative return of -2.7%. For comparison, a buy and hold strategy in the S&P 500 has only generated an annualized return of 6.8%. These statistical findings underscore the powerful ability of the WSC Trend Index to filter out market noise and identify long-term trends that can generate significant returns for investors.
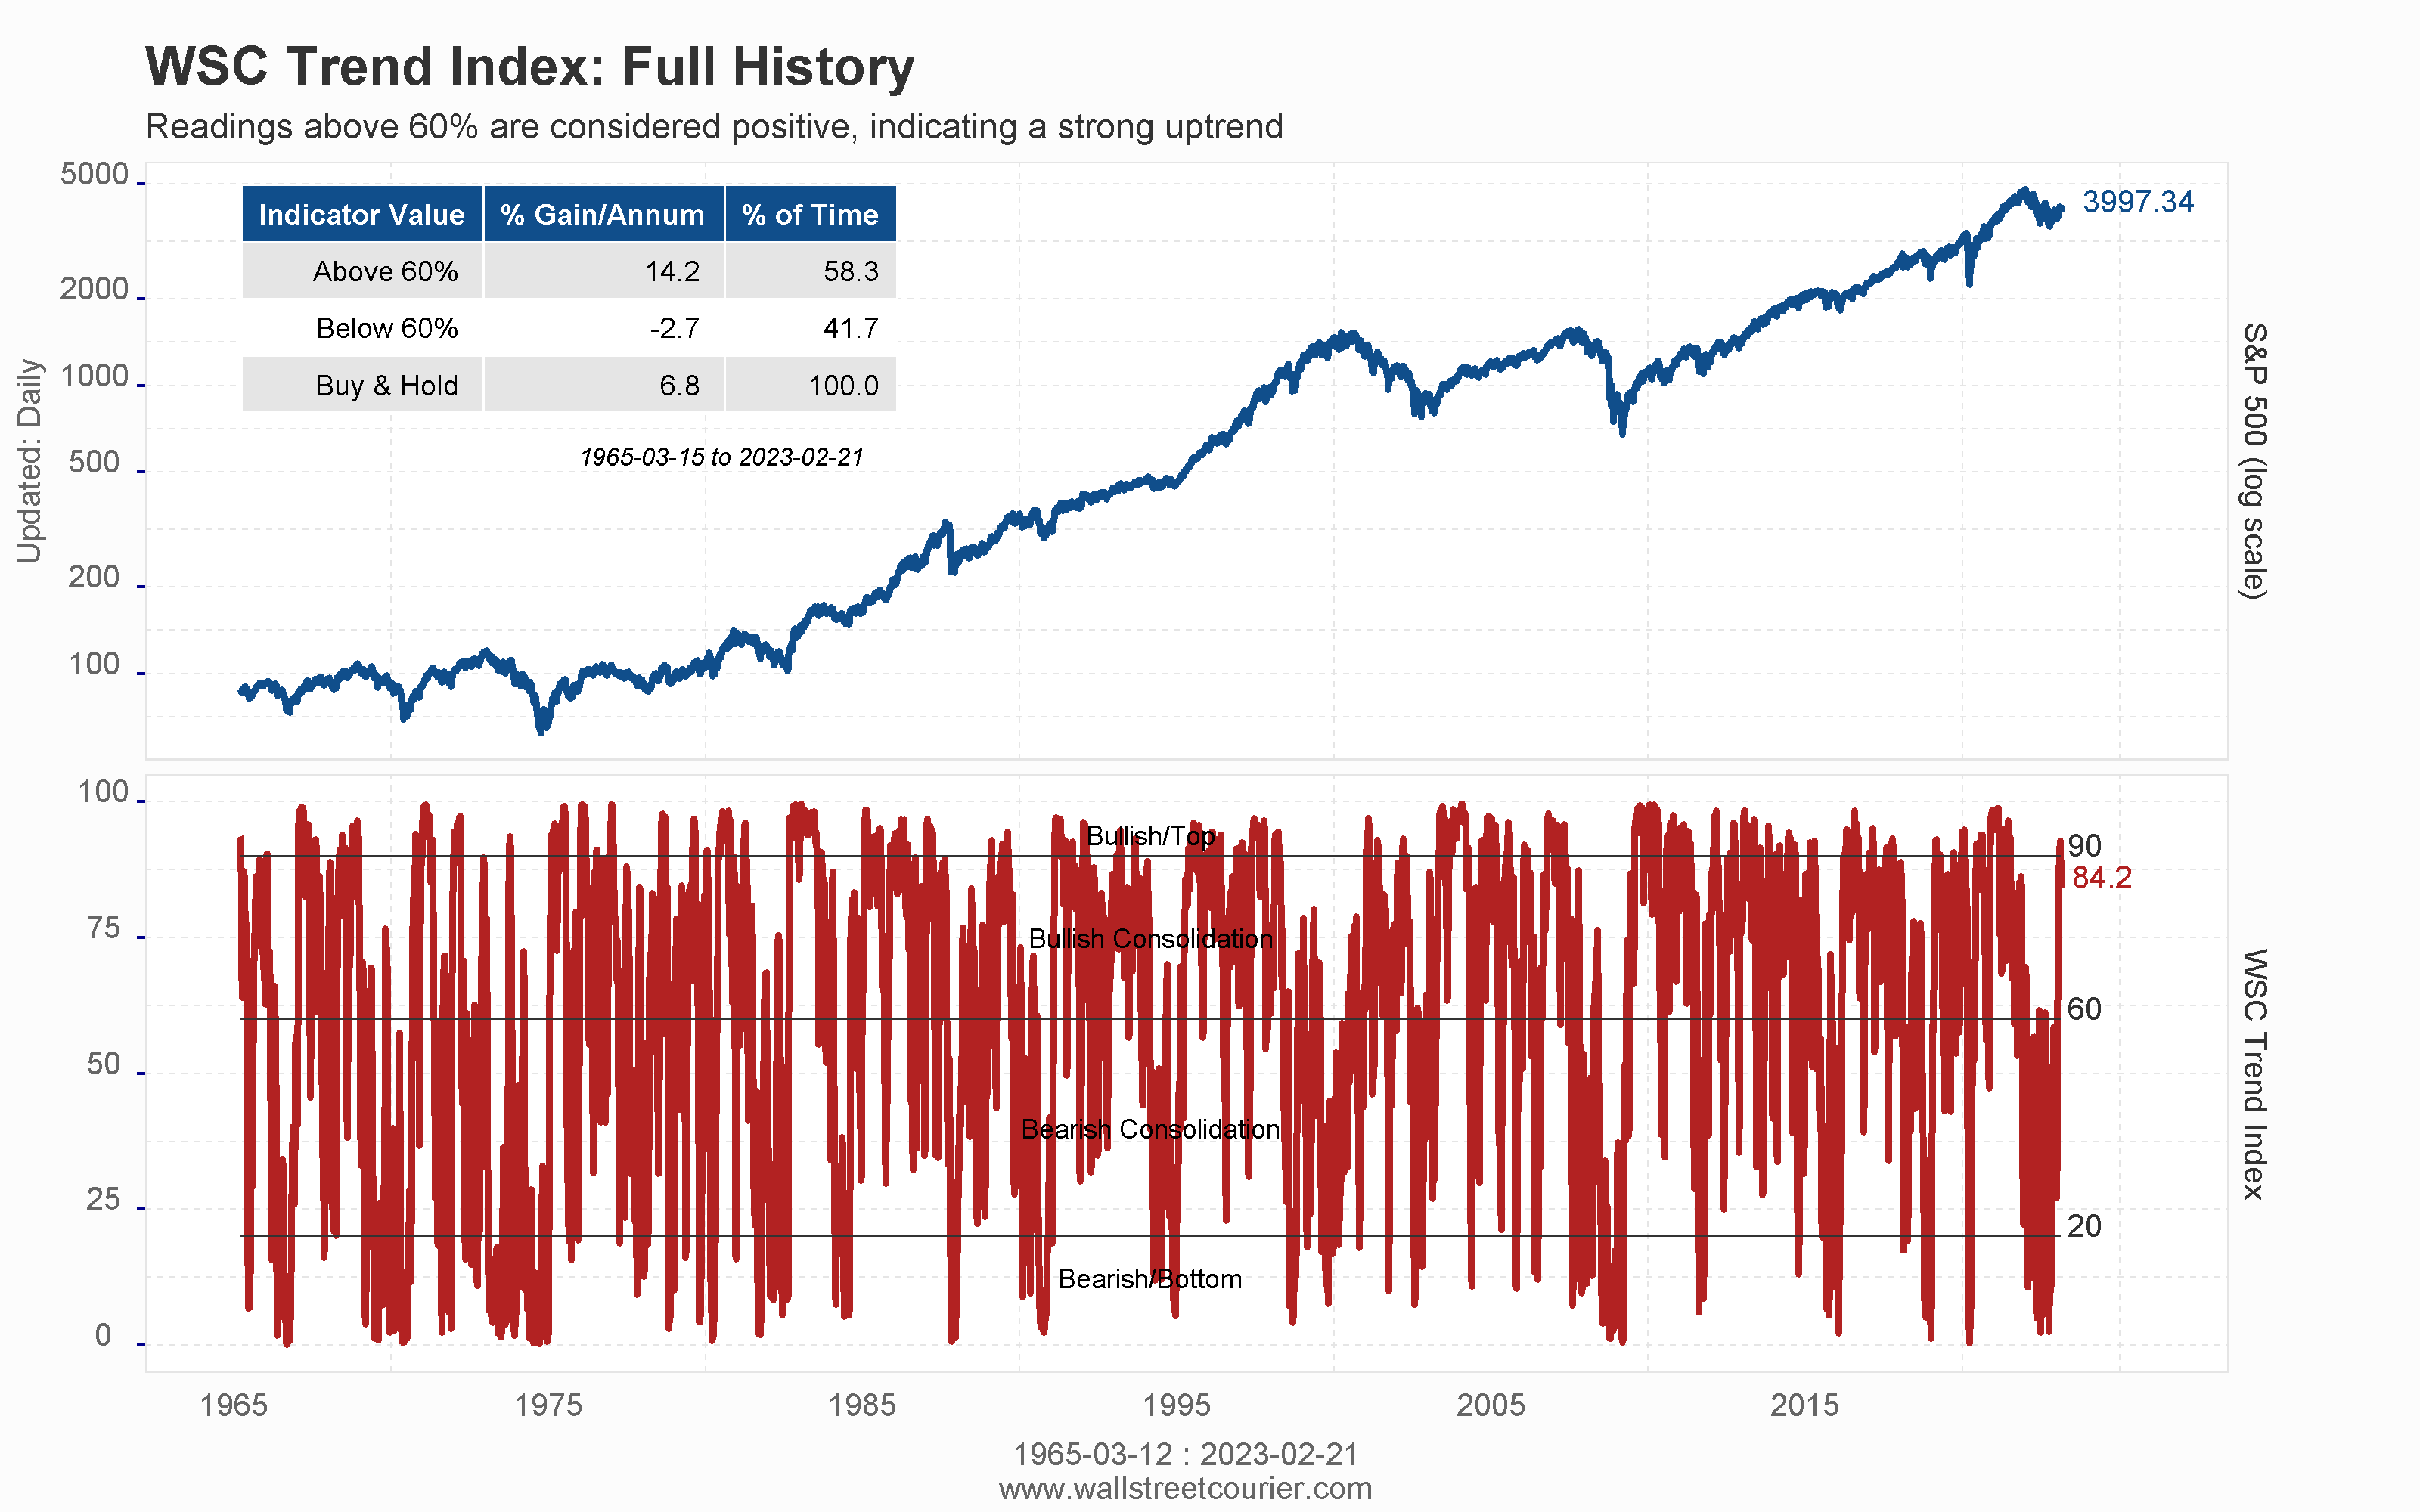
The WSC Trend Index generates a signal ranging from 0 to 100, providing investors with a clear understanding of the current momentum of all U.S. listed stocks. A reading of 0 indicates an outright negative trend, while a reading of 100 means the opposite, indicating a strong positive trend.
Additionally, the direction of the WSC Trend Index itself can provide valuable information to investors. If the trend is upward and increasing, it suggests that the market is becoming more bullish, and vice versa. This information can be used as an additional source of information for investors when making investment decisions.
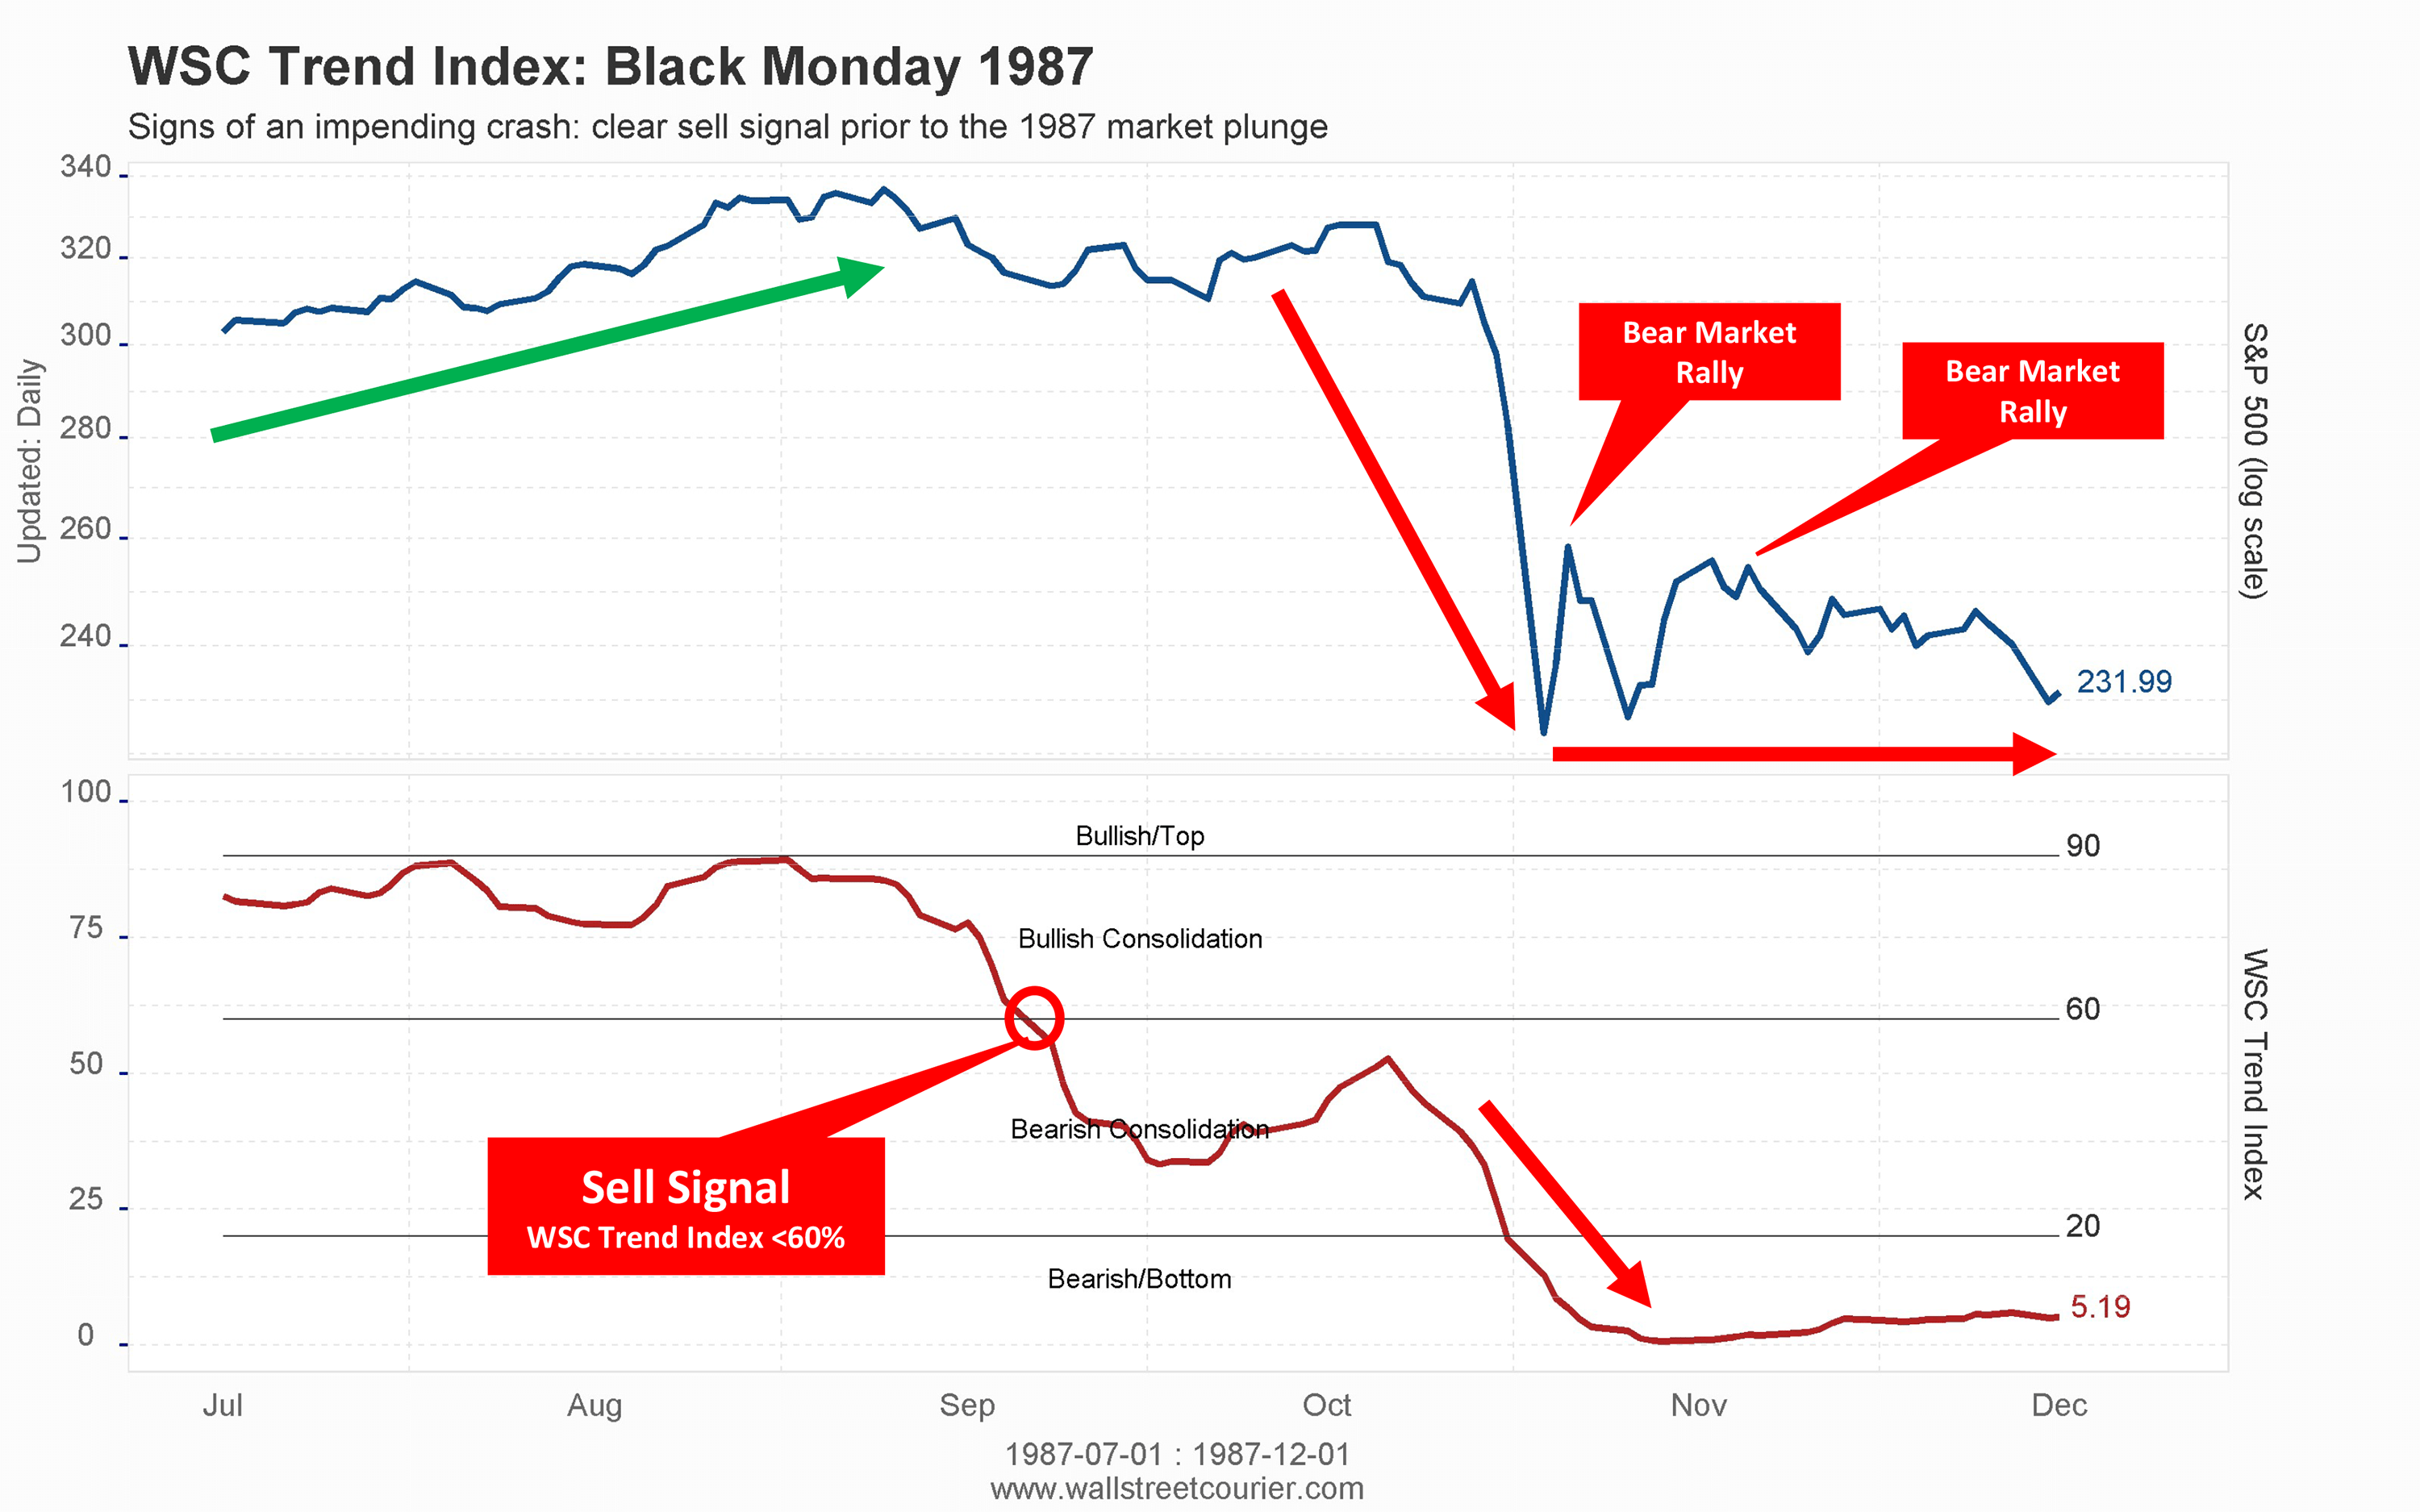
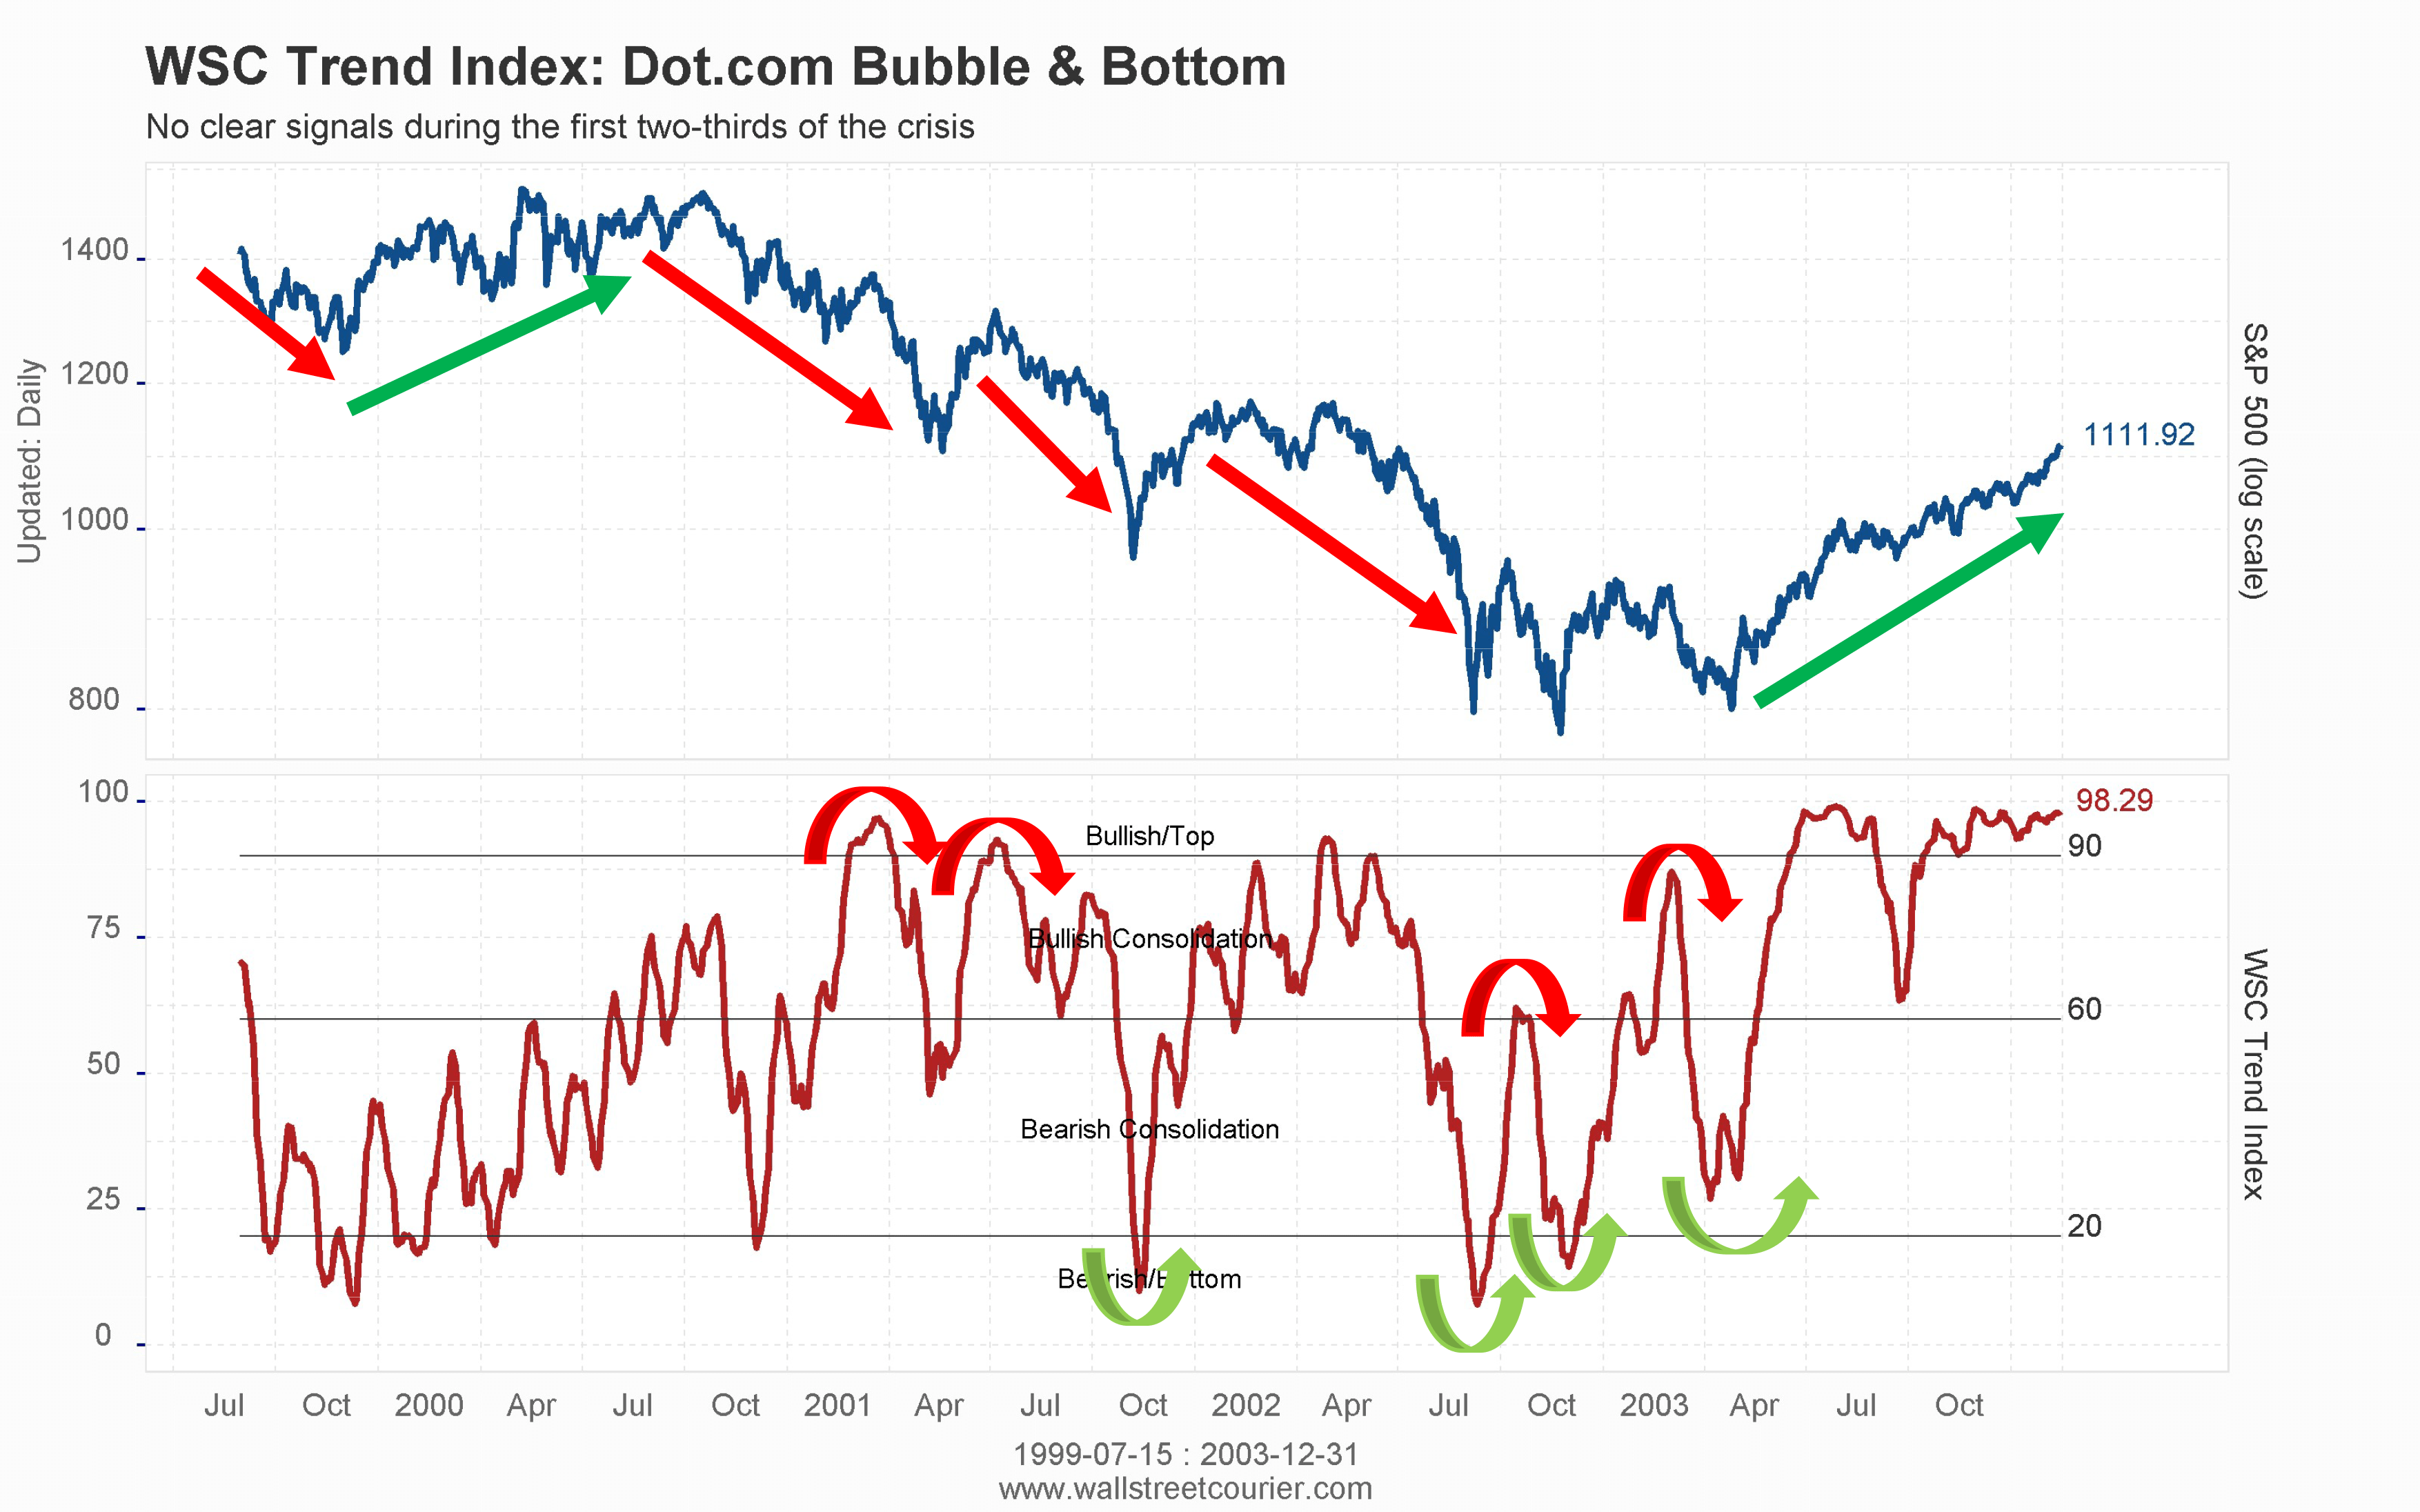
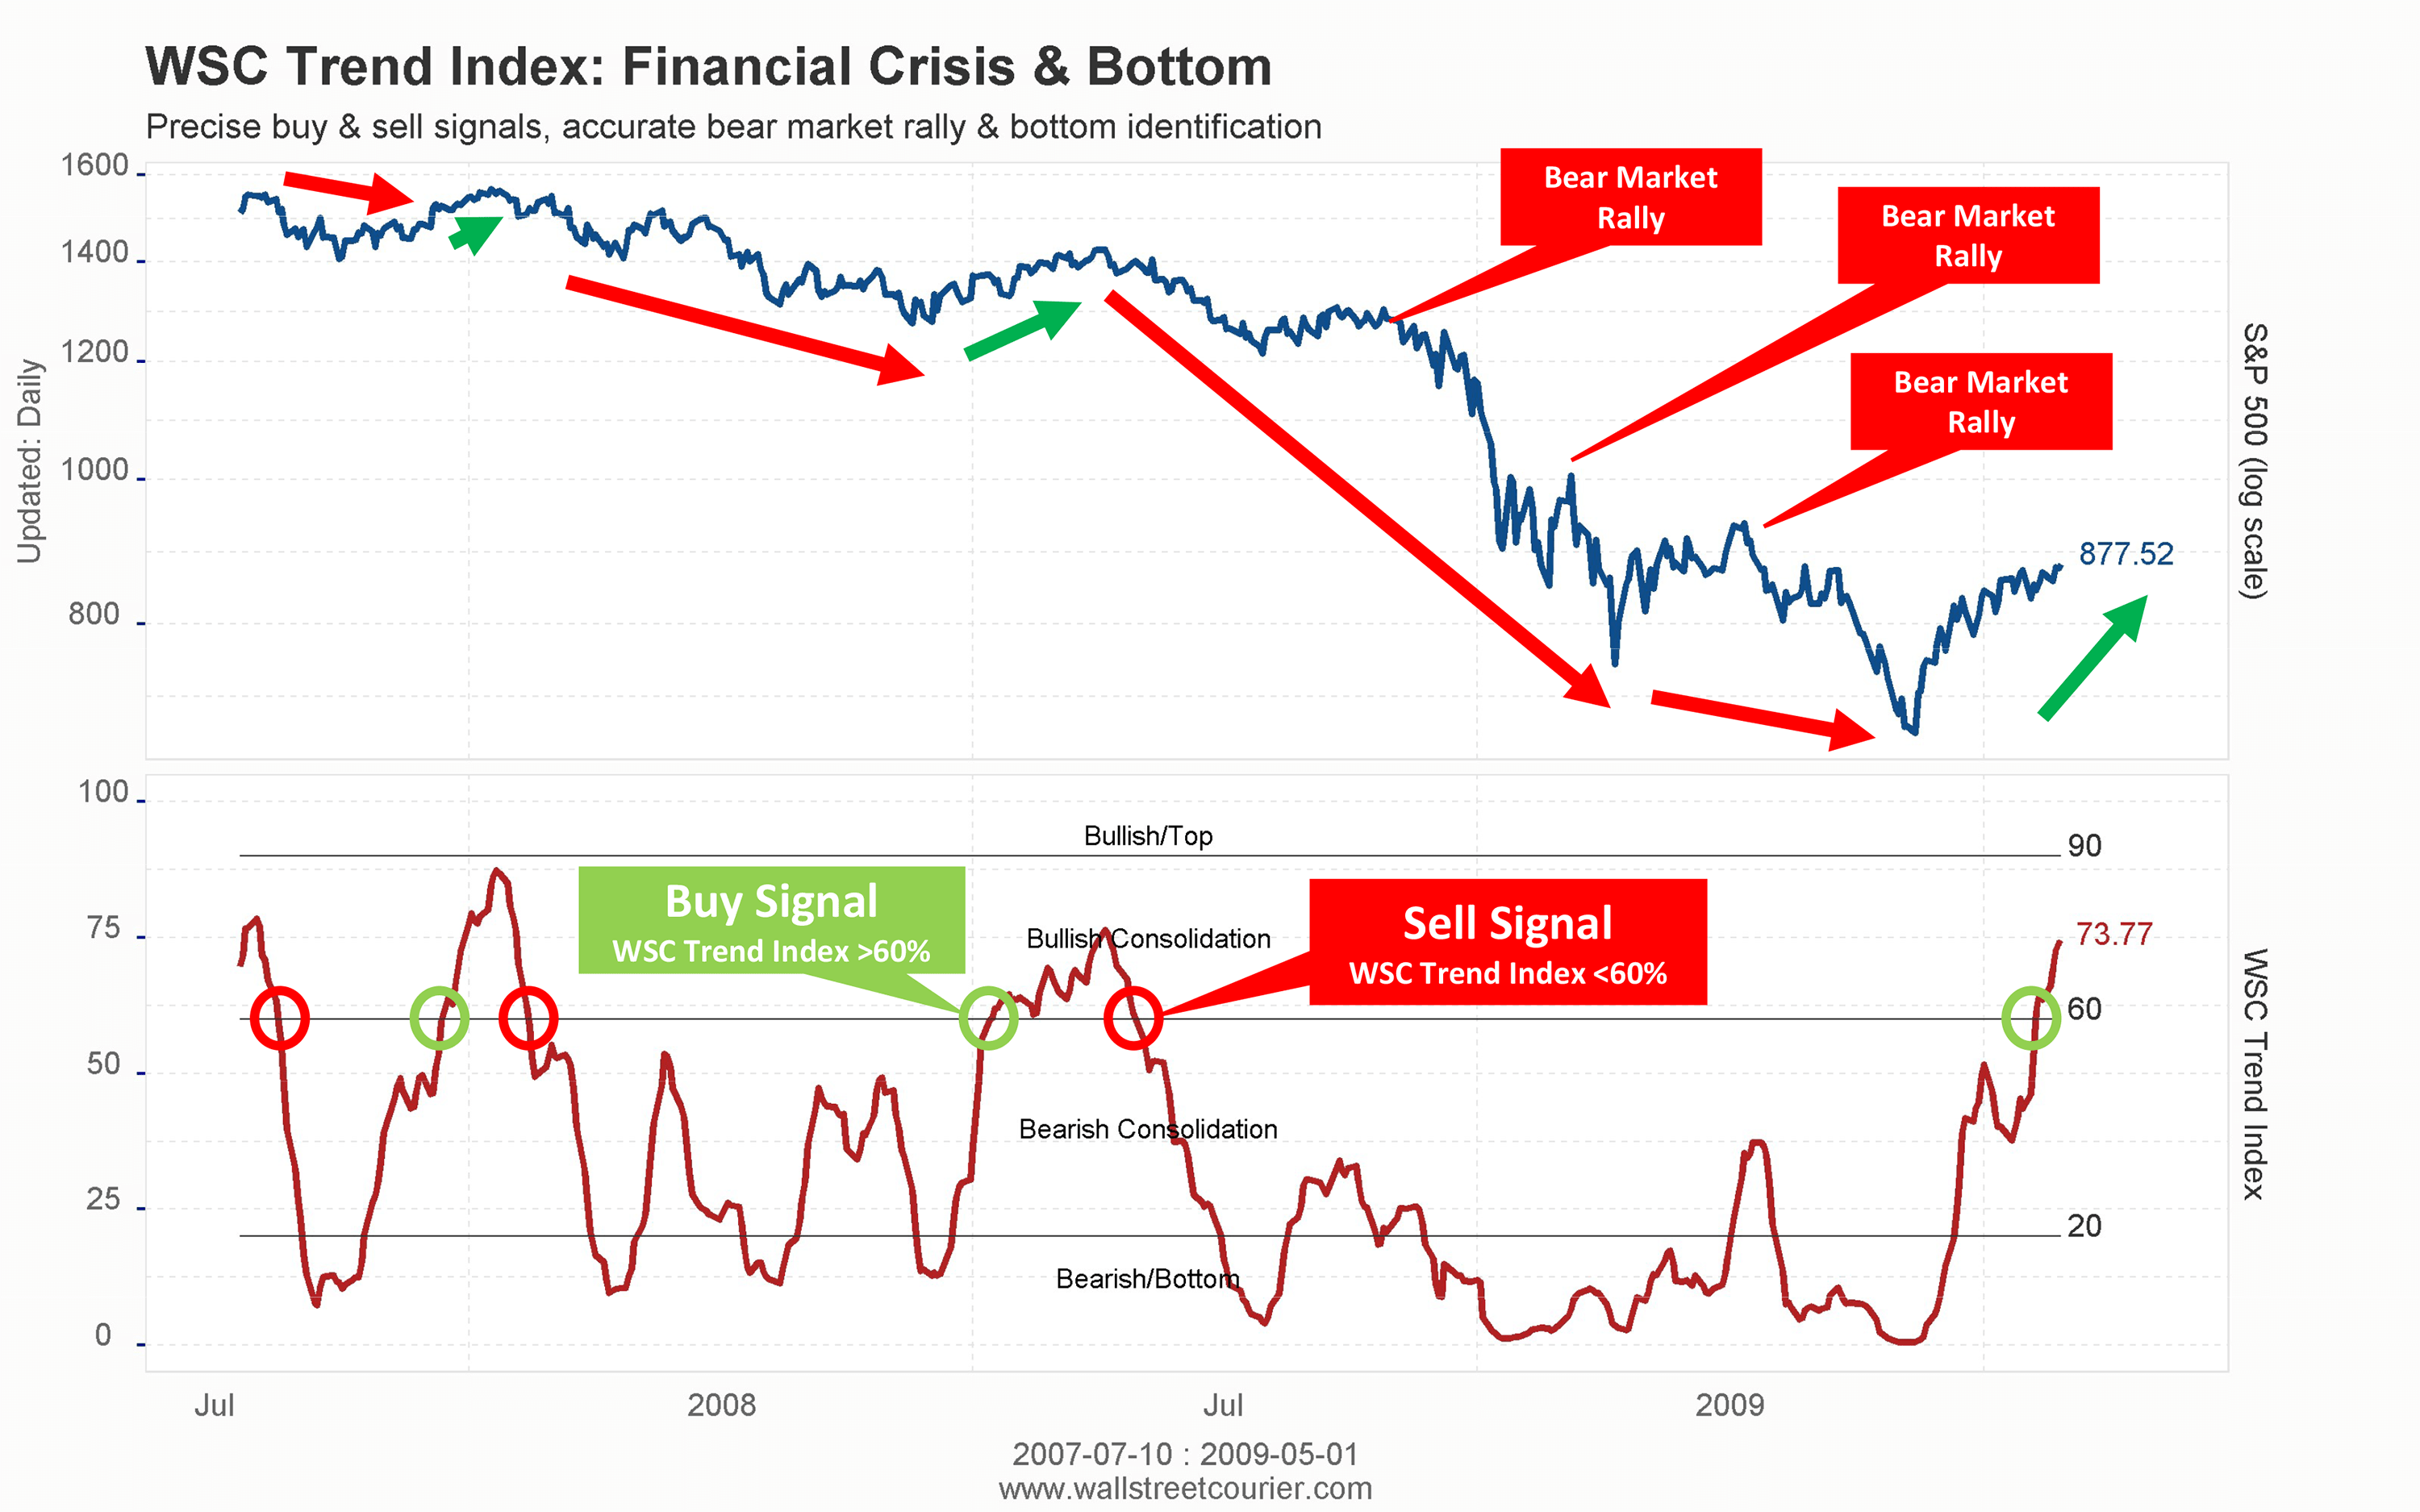
The WSC Trend Index has a track record of accurately predicting major market reversals, including the 1987 crash, the financial crisis, and the recent pandemic-induced downturn. Although the dot-com crash of 2000 posed a challenge, the WSC Trend Index has consistently provided clear buy and sell signals during market tops and bottoms. As a result, it’s a must-have tool for serious trend investors looking to make informed decisions and capitalize on sustainable trends.
The chart effectively demonstrates the WSC Trend Index’s ability to flash a sell signal prior to the 1987 market crash, as most stocks in the S&P 500 had already started to weaken weeks before. This highlights the indicator’s effectiveness in avoiding the typical late-in and late-out effects of conventional trend indicators.
This is a very rare example, where the WSC Trend Index struggled to provide clear guidance. Due to the exclusion of multiple non-profitable tech stocks in the S&P 500 during the dot-com crisis, the bottom-up trend picture was distorted. As a result, the WSC Trend Index signal faced increased volatility during the first third of the crisis. However, it was able to accurately predict the market bottom in 2003.
The WSC Trend Index demonstrated its effectiveness in providing investors with reliable guidance during the 2008 financial crisis. Amid the challenging market conditions, the index helped investors avoid the pitfalls of bull traps during the bear market while also accurately calling the market bottom in 2009.
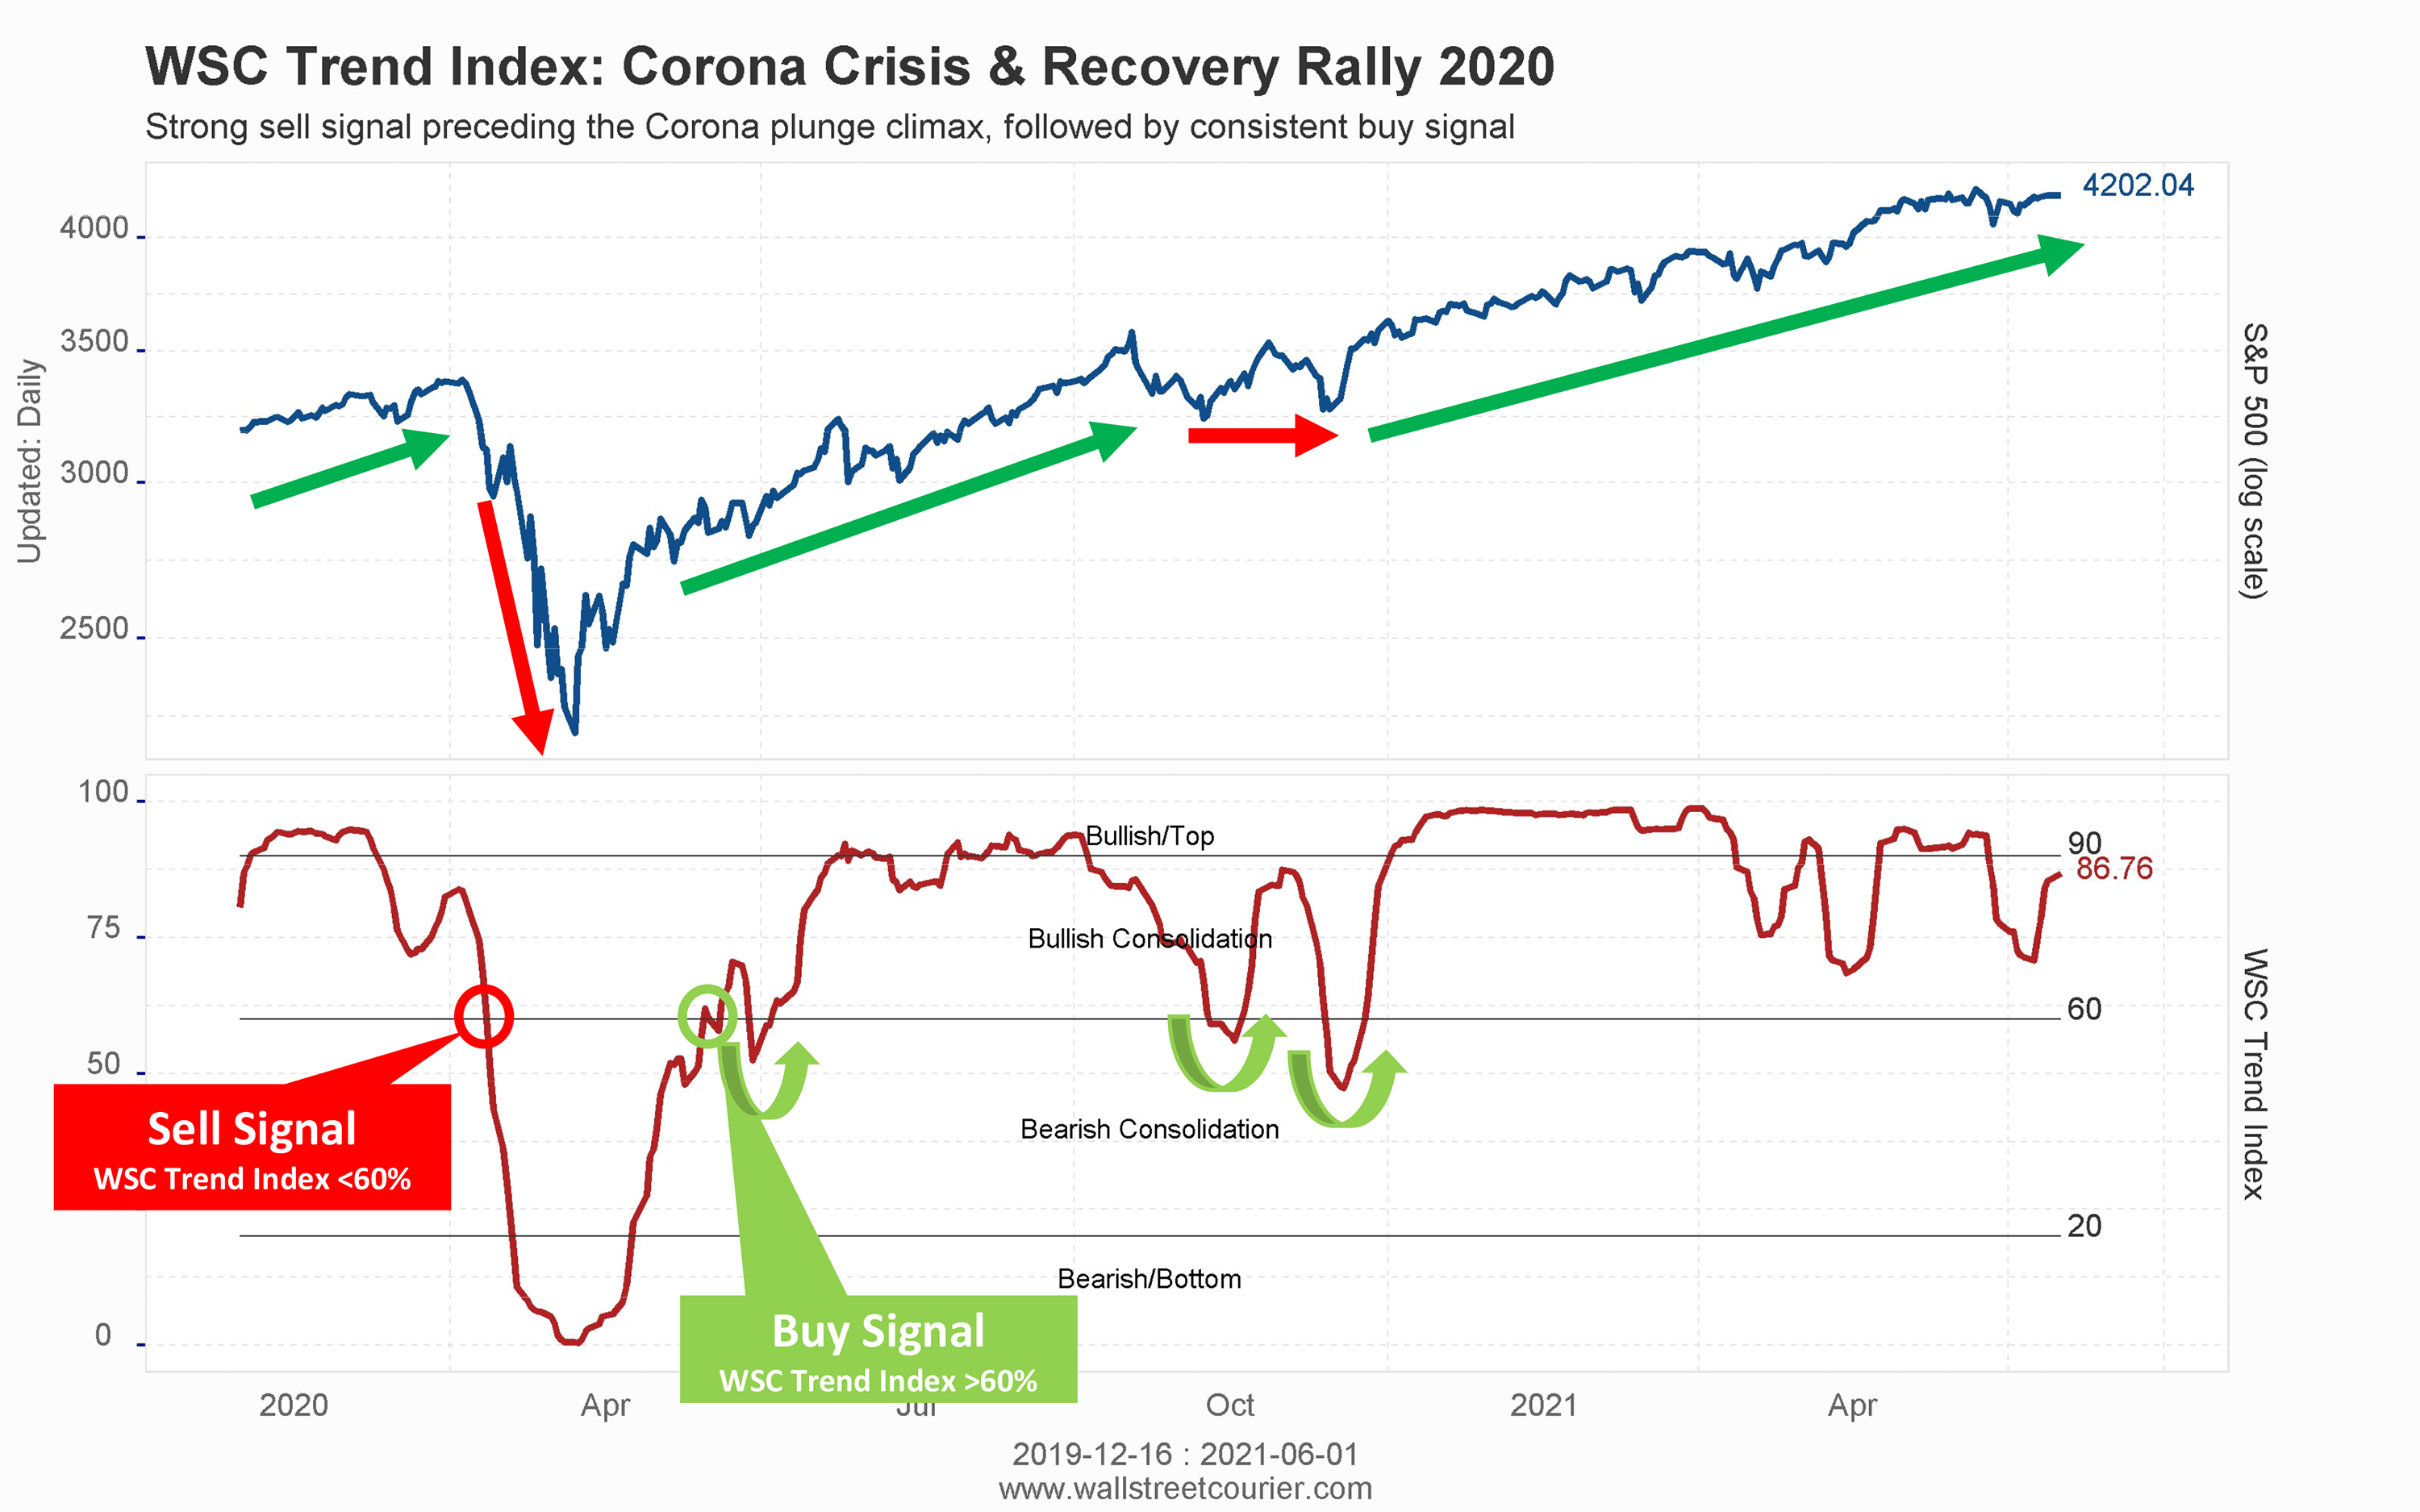
The COVID-19 pandemic sparked the fastest bear market and recovery in recorded history, with the market losing 34% and then reaching a new high just 106 days later. These strong V-shaped reversals can be a significant challenge for conventional trend indicators. However, the WSC Trend Index was able to provide valuable guidance during this volatile period. The index issued a timely sell signal prior to the market’s meltdown, and it quickly turned bullish again in early April, even though many investors were still skeptical of the recovery. Despite ongoing lockdowns, the indicator remained bullish, and the S&P 500 rallied significantly, demonstrating the effectiveness of the WSC Trend Index.
Are you looking for reliable investment tools to help you stay ahead of the game? As a subscriber of WallStreetCourier, you’ll gain access to exclusive market insights and resources that can help you make informed investment decisions.
One of the most powerful tools at your disposal as a subscriber is the WSC Trend Index. This daily updated index provides invaluable insights into market trends, allowing you to identify potential investment opportunities and make the most of market movements. With the WSC Trend Index and a range of other resources available to you, including market analysis and investment strategies, you can confidently navigate today’s complex financial landscape and maximize your returns.
To learn more about these valuable resources and how they can benefit you as an investor, become a member. With WallStreetCourier, you can access the tools and insights you need to succeed in today’s fast-paced financial markets.
Start your journey towards informed and strategic investment decisions. With WallStreetCourier, you have the tools and insights to navigate market trends confidently. Join us today and transform your approach to trend following.
You are currently viewing a placeholder content from X. To access the actual content, click the button below. Please note that doing so will share data with third-party providers.
More Information