
S&P 500 Drawdowns · 95 Years of Data · Research
Since 1928 the S&P 500 has been below a previous high on more than 40% of all trading days. Fifteen bear markets, 18 stronger corrections, 51 corrections and 74 pullbacks: this is what 95 years of declines look like in numbers, and what they mean for the next one.
Definition
A drawdown is the decline from the most recent peak to the following trough. For the S&P 500 it ranges from a pullback of a few days to a bear market that takes years to recover.
Four severity categories are in common use: a bear market is a decline of more than 20% from peak to trough, a stronger correction 10% to 20%, a correction 5% to 10%, and a pullback 3% to 5%.
A drawdown is not a sign that something has gone wrong. It is the price of being invested in equities, and its frequency, depth and duration can be measured.
WallStreetCourier measured every closing-price drawdown in the S&P 500 from January 1928 to December 2023. Ninety-five years cover every bear market, correction and pullback the index has produced, including the Great Depression, Black Monday, the dot-com crash, the financial crisis and the Covid crash.
S&P 500 closing prices, January 1928 to December 2023. Source: WallStreetCourier Research.
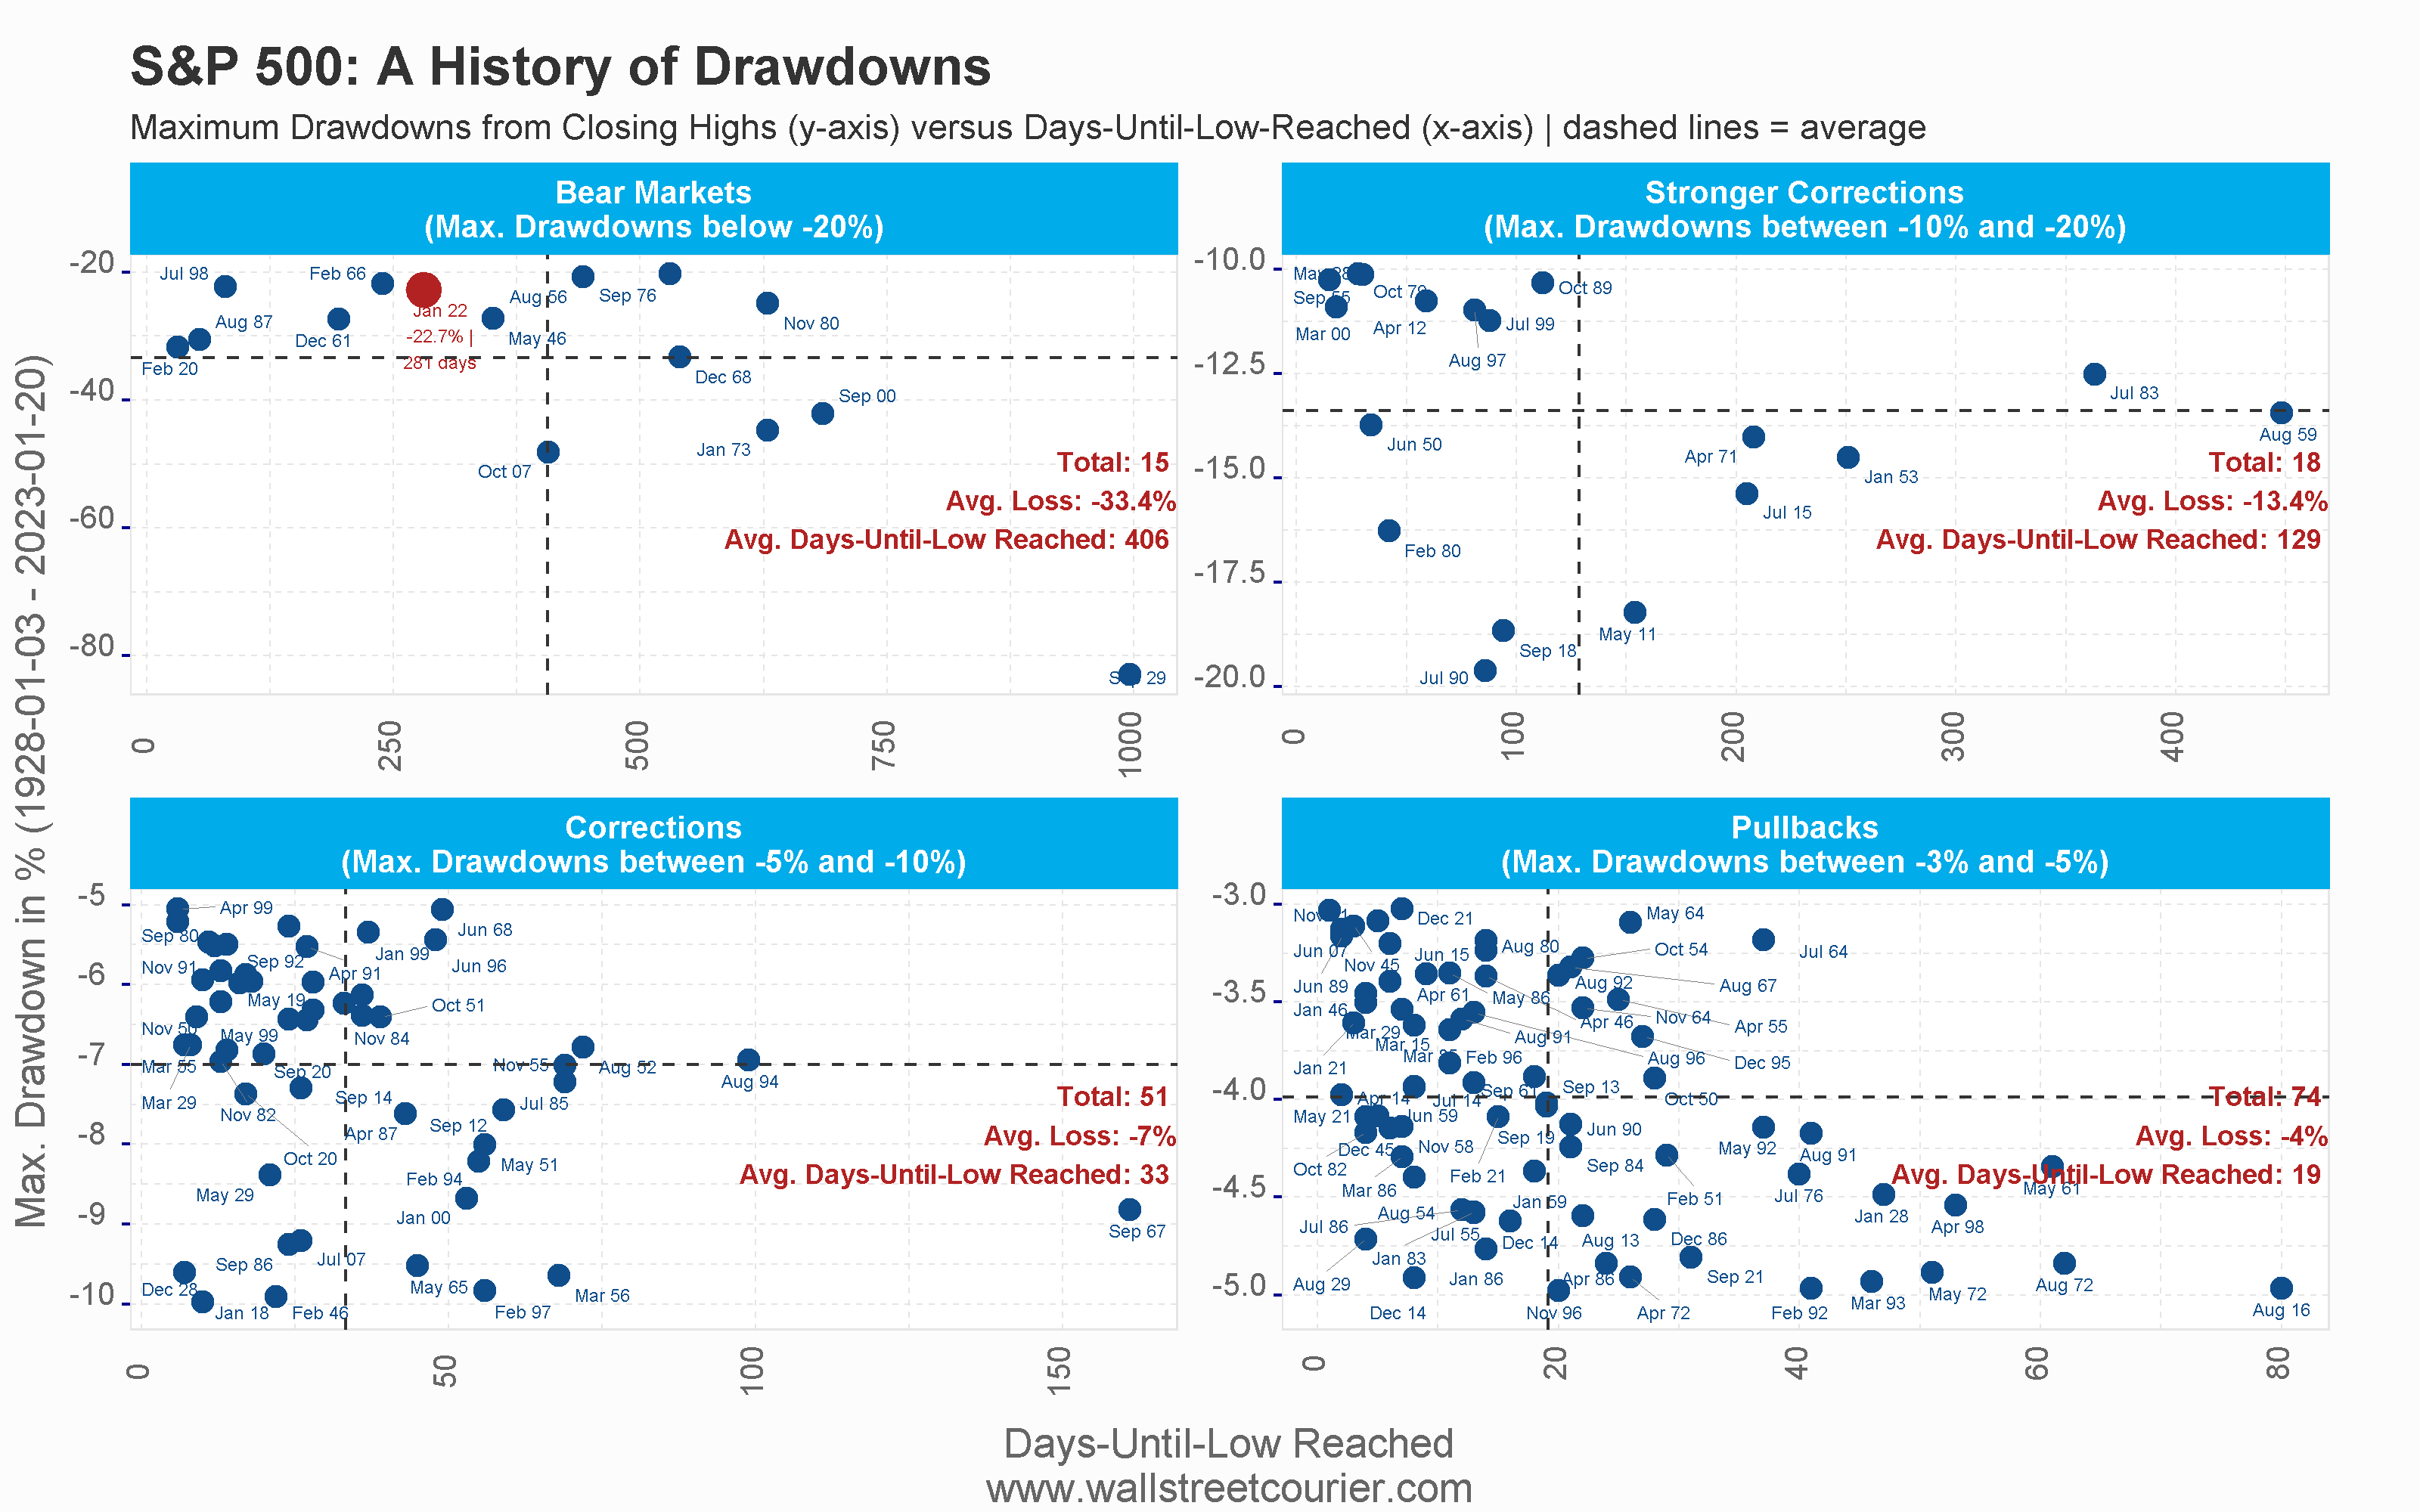
Fifteen times since 1928 the S&P 500 has lost more than 20% from a peak. Together those declines fill 8,520 trading days, one quarter of the whole period. On average a bear market arrives every six years and takes 406 trading days, about 19 months, to reach its low.
The averages hide how different the episodes are. The Covid crash reached a 34% loss in 32 trading days; Black Monday in 1987 bottomed in 54. The Great Depression took 996 days and 82% of the index's value, and more than two decades passed before the old high was seen again. The financial crisis of 2008 fell 48% in 407 days; the dot-com bear market took 685 days to lose 49%.
| Category | Count | Avg. decline | Avg. days to low |
|---|---|---|---|
| Bear marketDecline of more than 20% | 15 | −33.4% | 406 days |
| Stronger correction10% to 20% | 18 | −13.4% | 129 days |
| Correction5% to 10% | 51 | −7.0% | 33 days |
| Pullback3% to 5% | 74 | −4.0% | 19 days |
| All drawdowns of 3% or more | 158 | 14,900+ days |
Days are trading days from peak to trough. Shares of period are rounded and overlap slightly where one drawdown contains another.
Bear markets dominate the history books, but most of the time an investor spends below a prior high is spent in smaller declines. Since 1928 the index has produced 18 stronger corrections, 51 corrections and 74 pullbacks, and in a normal year an investor should expect several of the last kind.
Stronger corrections, 10% to 20%. The longest ran from August 1959 to October 1960: 448 days for a 13% loss. The shortest found its low in 15 days (September 1955) and made a new high 34 days later. The 18 episodes add up to 3,286 trading days, about 9.4% of the period.
Corrections, 5% to 10%. Fifty-one episodes, averaging a 7% loss over 33 days. One outlier in 1967 lasted 161 days and pulls the average up; the median is closer to 26 days. Together they account for 1,701 trading days, about 4.9% of the period.
Pullbacks, 3% to 5%. The most frequent category, with 74 episodes. The shortest lasted one day (November 2021, −3%); the longest, in August 2016, took 80 days to lose 4.9%.
What the numbers add up to. Across all four categories, the S&P 500 has been in a drawdown of 3% or more on over 14,900 of the trading days since 1928. Declines are not interruptions of the market; they are two fifths of it.
From the record to the present
The statistics above describe declines after they have happened. Investors live them from the other side, while an index is still near its high and nobody knows whether the next 5% is a pullback or the first leg of a bear market. The price does not answer that question. The market's internal condition sometimes does.
Before most large declines, the support behind the index weakens first: fewer stocks take part in the advance, volume stops confirming new highs, and positioning becomes crowded. WallStreetCourier measures that support after every close with 40 indicators of trend, market breadth and sentiment, and classifies each market as risk-on, where investors are being paid to hold risk, or risk-off, where they are not.
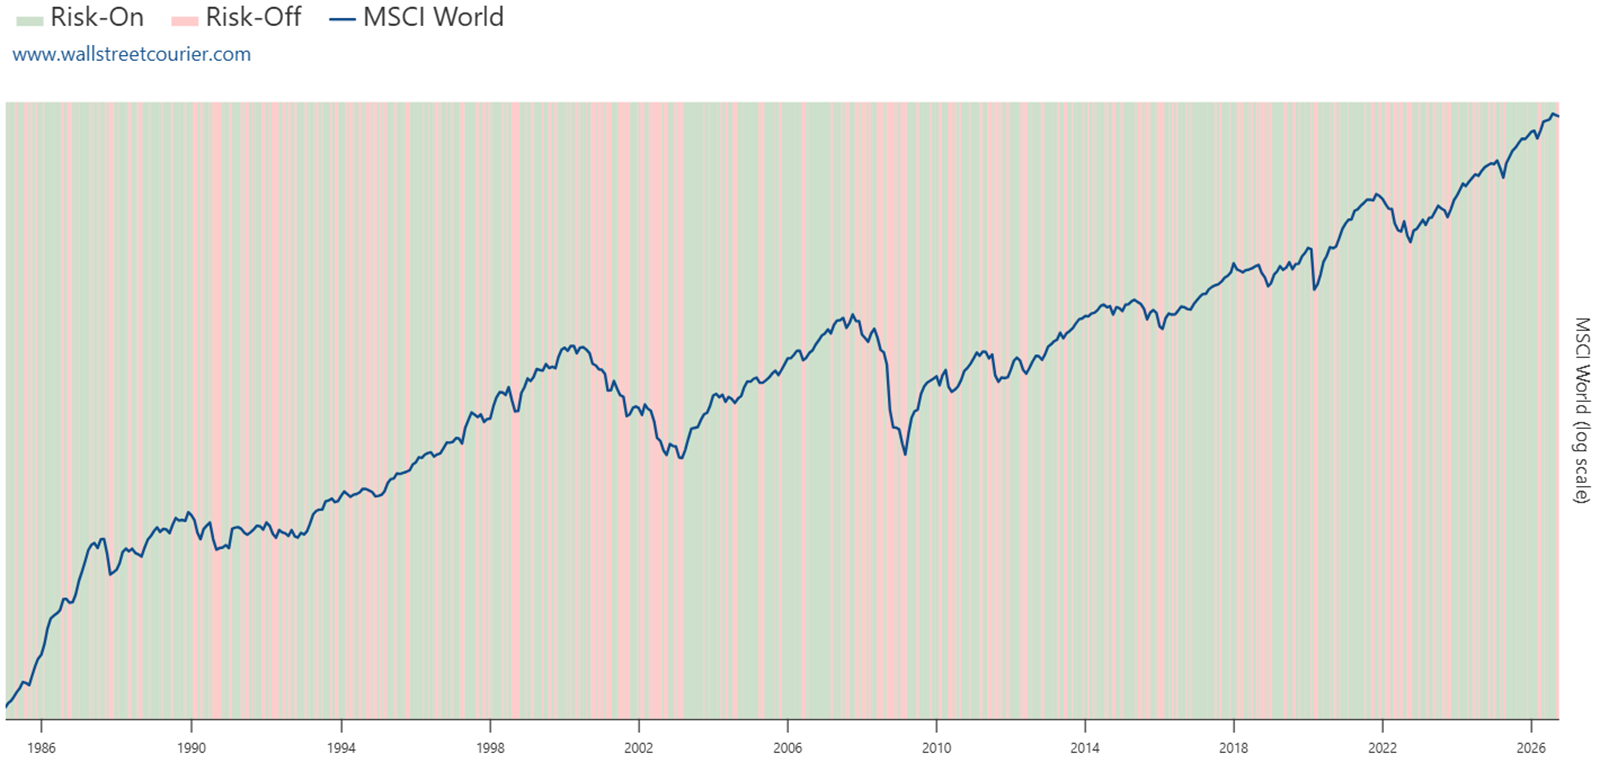
Applied to the MSCI World from January 1985 to June 2026, the classification sorts the record of losses almost cleanly:
MSCI World, 7 January 1985 to 11 June 2026. Historical regime statistics, measured close-to-close within each classified state; not the results of a trading strategy.
Risk-off is not a sell signal. More than half of all risk-off phases ended at or above their starting level, and in October 1987 the classification switched one day after the crash, not before it. What it does is identify the conditions under which the deep drawdowns in this article have historically developed, early enough to size exposure against a measured condition rather than against a decline that has already happened. How risk-on and risk-off are measured →
Knowing the history of drawdowns is the foundation. Getting through the next one takes a method. Three approaches have an evidence base; they differ in what they demand of the investor and in what they give up.
01
Tactical investing changes portfolio exposure when measurable market conditions change: trend strength, breadth, sentiment and institutional positioning. The aim is not to call the top but to hold less when the market stops rewarding risk and more when it does.
Done with discipline it reduces the depth of the worst drawdowns while keeping most of the bull markets. What it takes is a rules-based framework that makes the allocation decision before the day it matters, and the willingness to follow it when the headlines argue otherwise. In WallStreetCourier's framework the regime informs how much exposure to carry; it does not switch a portfolio on and off.
WallStreetCourier's framework condenses its 40 indicators into three Market Health Scores from 0 to 100. The short- and mid-term scores decide whether a market is risk-on or risk-off; the long-term score sets the structural context, with 50 and above marking a structural bull market and below 50 a structural bear market.
02
Spreading a portfolio over equities, bonds, commodities and alternatives has historically reduced volatility and softened drawdowns. The buffer works as long as the assets fall at different times.
Increasingly they do not. In 2022 stocks and bonds fell together and the 60/40 portfolio had its worst year in five decades. Correlations between asset classes rise in exactly the stress events diversification is supposed to protect against.
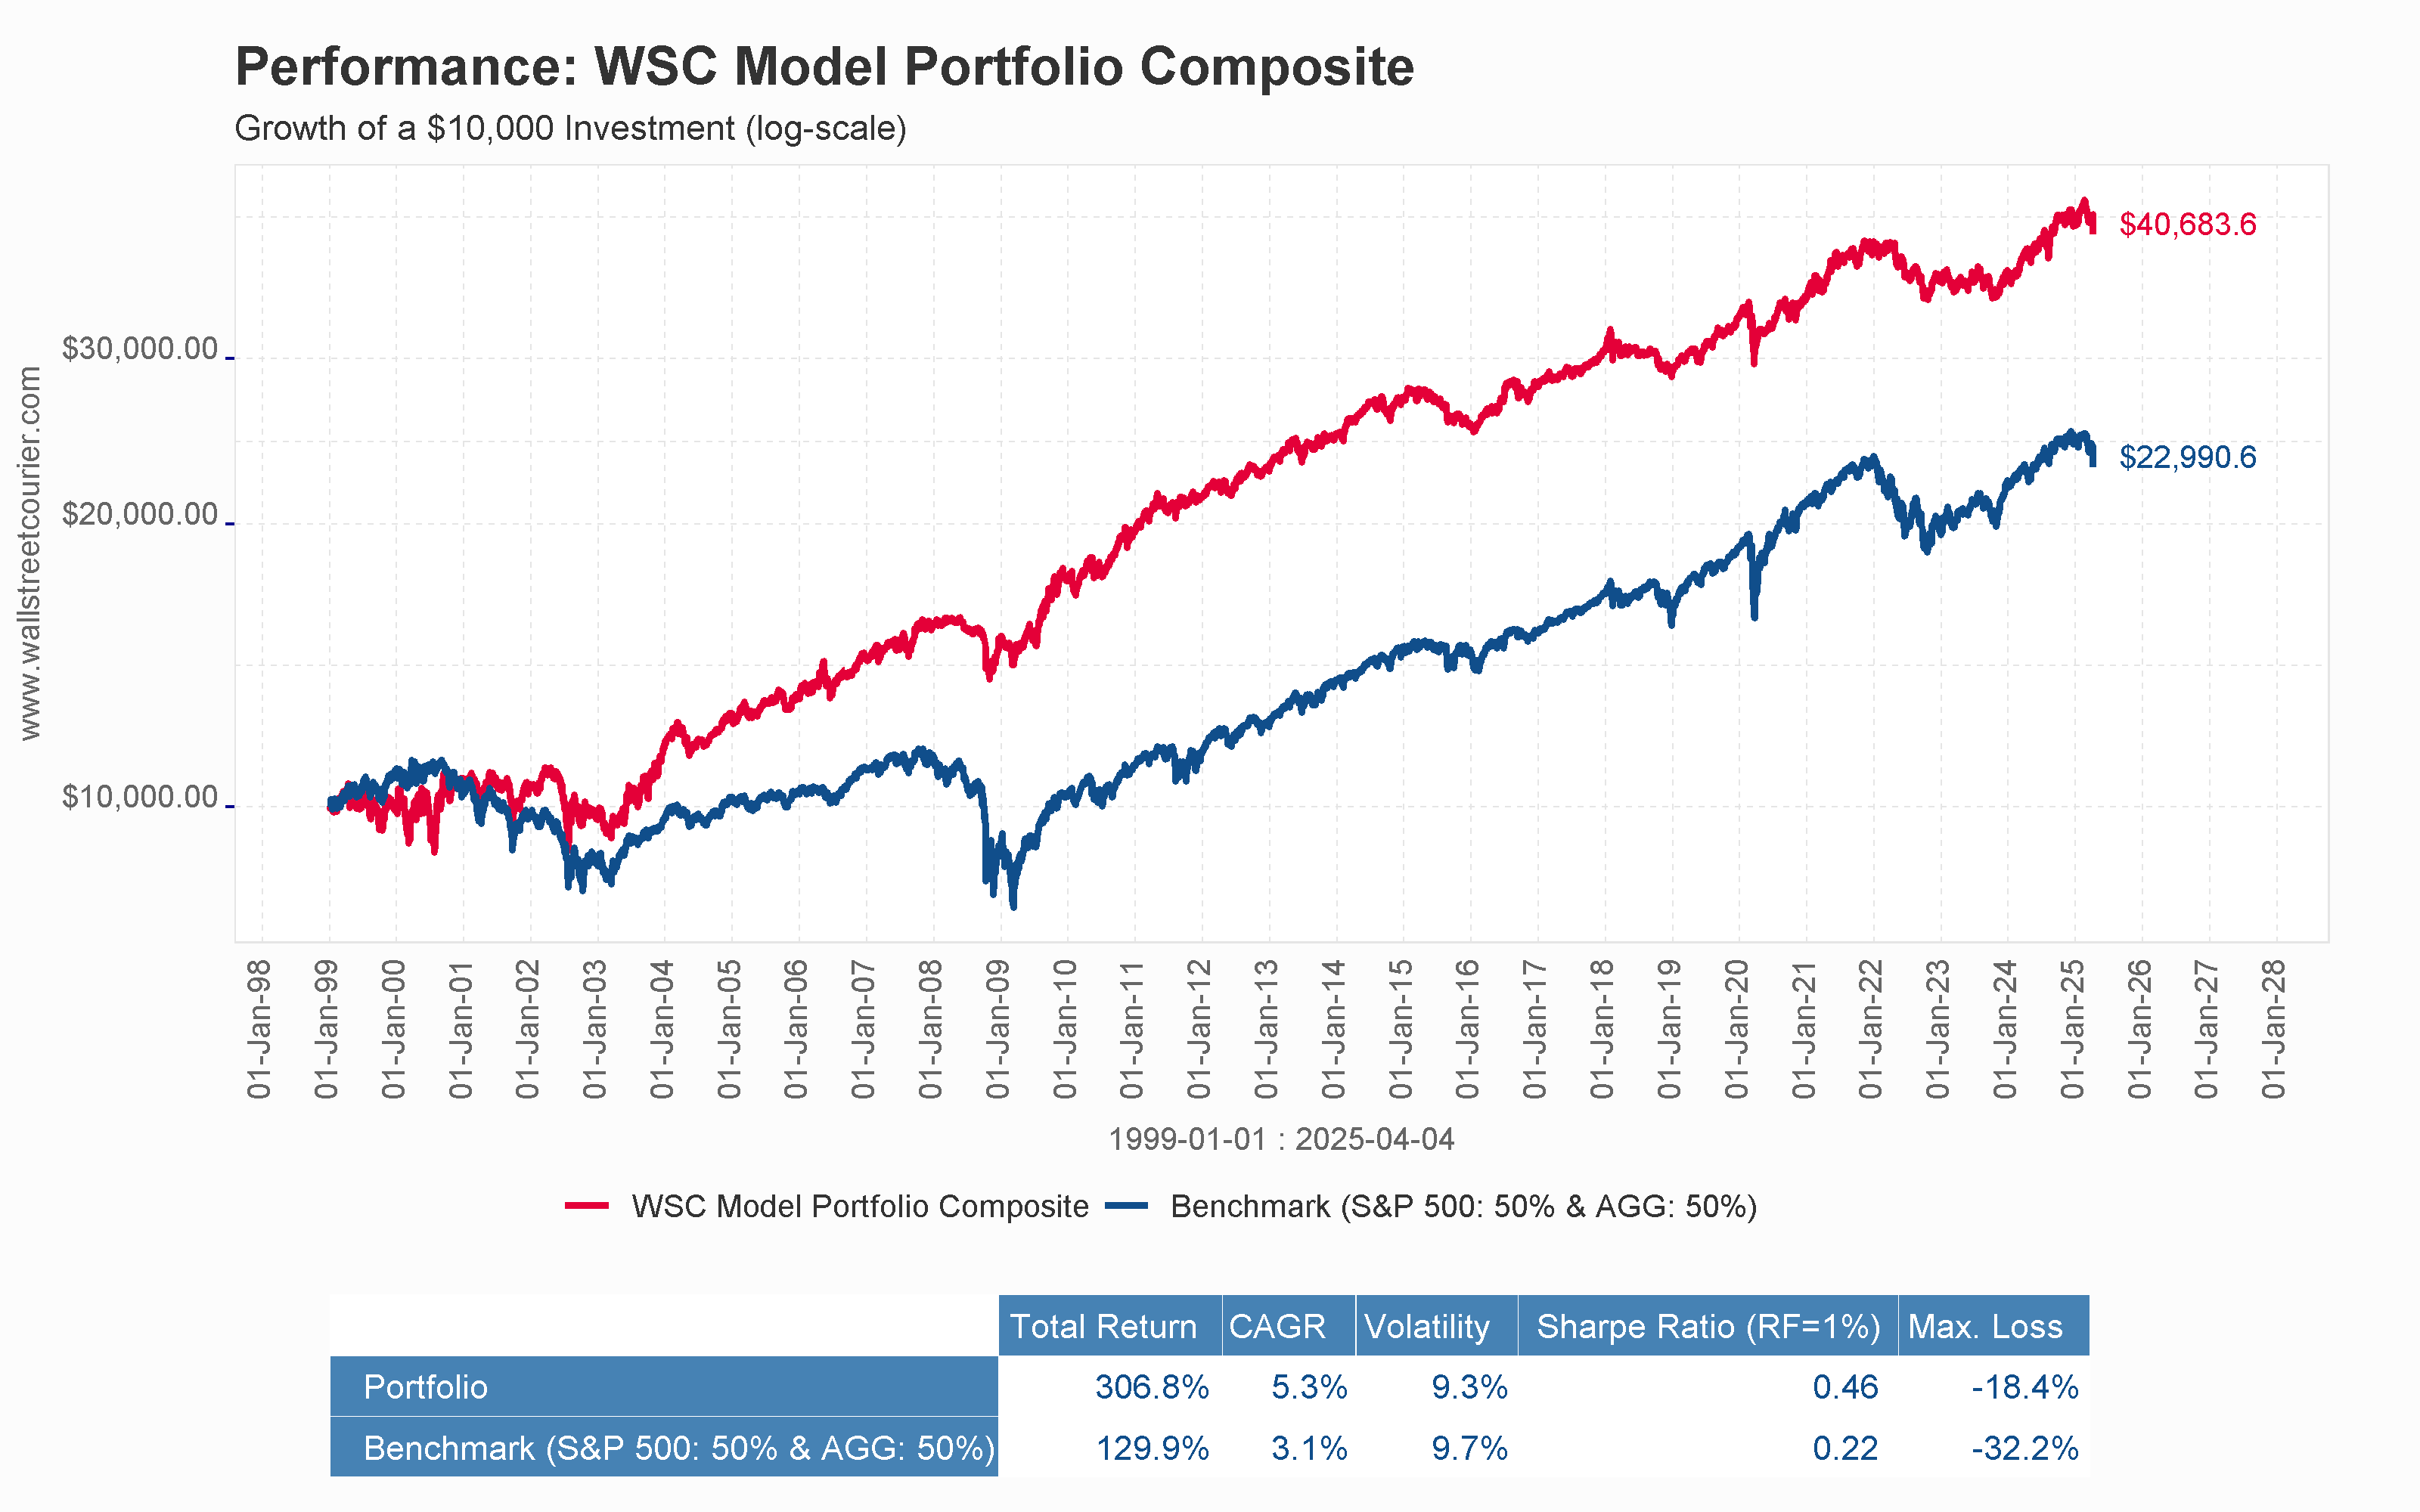
The answer is to diversify across strategies and market regimes as well as across assets, so that no single environment can hit every part of the portfolio at once. WallStreetCourier's Model Portfolios are built on that principle.
03
Buy and hold rests on a fact: the S&P 500 has recovered from every decline in its history. It avoids trading costs and timing mistakes and collects the full compounding of equity returns.
Its price is paid in the bear markets. An average loss of 33% over 406 trading days is a multi-year period with no certainty about when the recovery begins, and the record includes a 25-year wait for a nominal new high.
Buy and hold suits investors with a long horizon, no need to withdraw during a downturn and the temperament to watch a third of their capital disappear without acting. The data does not argue against it. It argues for knowing what the strategy asks before signing up for it.
See where the S&P 500 stands today
The record above is history. The regime is measured after every close. Free Basic access covers one full market each week, including its risk-on / risk-off status, Market Regime, all 40 indicators and the Daily Morning Briefing.
Official data provider of the Smart Money Flow Index for Bloomberg Professional since 2003
Disclaimer. All figures are historical index statistics and do not account for transaction costs, spreads, slippage or taxes. Past performance is not indicative of future results. Nothing on this page constitutes investment advice or a recommendation to buy or sell any security.
You are currently viewing a placeholder content from X. To access the actual content, click the button below. Please note that doing so will share data with third-party providers.
More Information