The purpose of Smart Money indicators in a broader sense, is measuring the buying behavior of institutional investors to give insight into the actions and strategies of experienced and well-informed investors. Smart money indicators, such as the SMFI or the CoT-Report, can provide a valuable perspective on markets and potential future movements.
On the other hand, dumb money indicators, such as retail buying, reveal the actions and strategies of less informed or emotional driven investors. By paying close attention to Smart Money indicators, investors can gain insight into the trading activities of experienced and well-informed investors, and potentially make more informed investment decisions.
To see the SMFI applied in practice, the current S&P 500 market analysis shows how smart money positioning combines with trend and breadth into a single market regime classification, updated daily.
The Smart Money Flow Index (SMFI) is an indicator used to identify the buying behavior of smart versus dumb money in the U.S. stock market. The Smart Money Flow Index (SMFI) is calculated according to a proprietary formula by measuring the action of the Dow during two key periods: shortly after the opening and within the last hour of trading. The first minutes of trading are often characterized by emotional buying, driven by greed and fear on the part of retail investors, based on good and/or bad news.
During the opening, there is also a lot of buying on market orders, as well as short covering. Smart money, on the other hand, typically waits until the end of the trading day to make their investments. These investors tend to test the market beforehand by shorting heavily to gauge the market’s reaction. Afterwards, they make the big investments. These heavy hitters tend to have the best possible information available and have an edge over all other market participants.
Developed by R. Koch in 1997, the Smart Money Flow Index (SMFI) quickly gained widespread popularity among both, retail and institutional investors. In 2003, Bloomberg approached WallStreetCourier to publish the indicator on their terminals, which are exclusively used by professional investors. Since then, WallStreetCourier has been recognized as the official source of the Smart Money Flow Index for Bloomberg Professional. This has led to an increase in popularity and widespread coverage in various articles and publications.
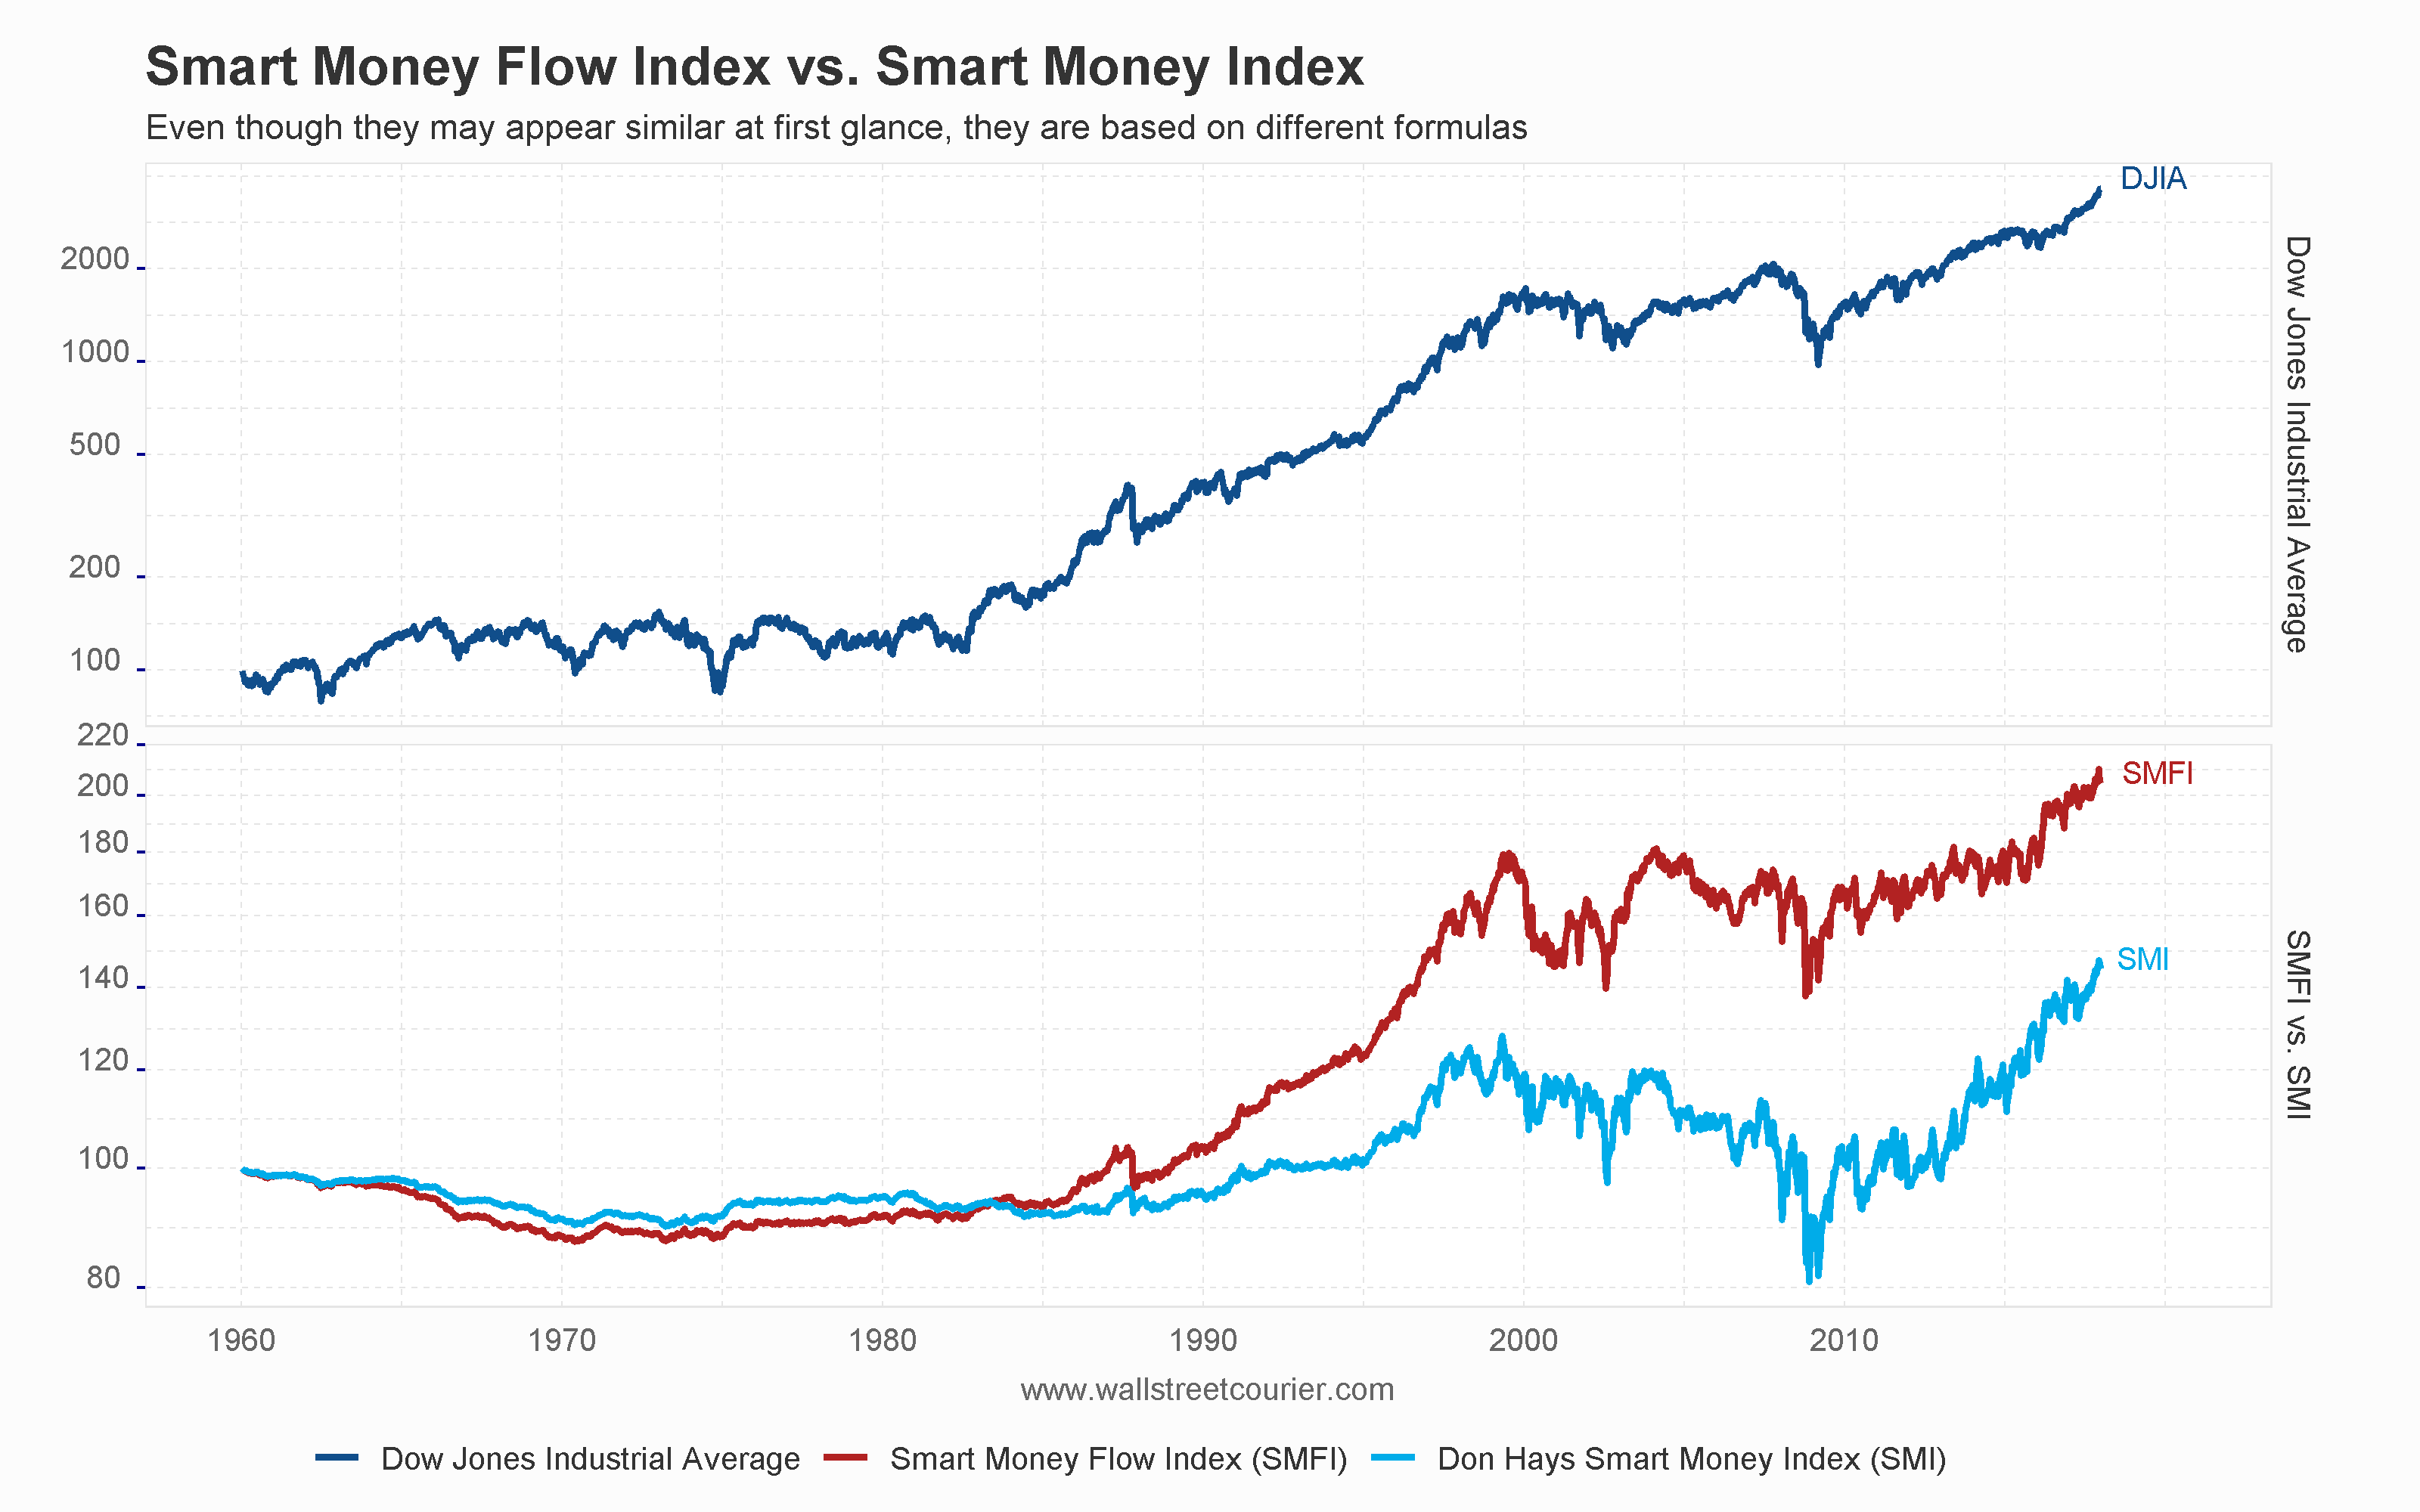
The Smart Money Flow Index (SMFI) and the Smart Money Index (SMI) are both indicators used to identify the buying behavior of institutional investors. However, it is important to note that they are distinct and separate indicators and should not be confused with one another. The SMFI, developed by R. Koch Senior, builds on the basic idea of Don Hays’ Smart Money Index by analyzing intra-day price movements at the opening and close, but uses a different formula. This results in fundamentally different signals, even though they may appear similar at first glance.
To further demonstrate this difference, the SMFI and SMI are compared to the Dow Jones Industrial Average on a monthly time frame in the chart below. This comparison clearly illustrates the significant spread between the two indicators, showcasing their distinct developments over time.
One of the key advantages of the SMFI is its ability to react strongly to upcoming market changes, as demonstrated in its performance during the dot-com boom of the late 1990s. Specifically, the spread between the SMFI and the Smart Money Indicator (SMI) from 1987 to 2000 shows that the SMFI was much more responsive to the dot-com mania than the SMI. Additionally, the SMFI also sent out a clear warning signal in late 1999 by dropping significantly, providing a valuable indication of the impending market downturn.
The comparison clearly illustrates the significant spread between the two indicators, showcasing their distinct developments over time
The Smart Money Flow Index (SMFI) and the Smart Money Indicator (SMI) are both indicators used to identify the buying behavior of institutional investors. However, their calculation methods are different. The Smart Money Flow Index (SMFI) formula is proprietary and not publicly available, while the SMI formula, developed by Don Hays, is as follows:
For example, if the Smart Money Index’s value yesterday was 100, and the Dow Jones Industrial Average gained 20 points in the first half hour and lost 40 points in the last hour, the Smart Money Index’s latest value would be 100 – 20 + (-40) = 80. The Smart Money Index by Don Hays can be calculated for any security.
The Smart Money Flow Index (SMFI) can be used in various ways to analyze the market and identify the buying behavior of institutional investors. Some of the ways to utilize the SMFI include:
The Smart Money Flow Index (SMFI) is a powerful indicator that has a strong track record in identifying major inflection points in the market. However, it’s important to remember that the SMFI should not be used as a standalone indicator for investment decisions. To gain a comprehensive understanding of the market trends, it’s crucial to use the SMFI in conjunction with other indicators and tools. This will help to confirm signals, provide additional insight, and increase the accuracy of interpreting the SMFI’s signals to gain a comprehensive understanding of the big picture.
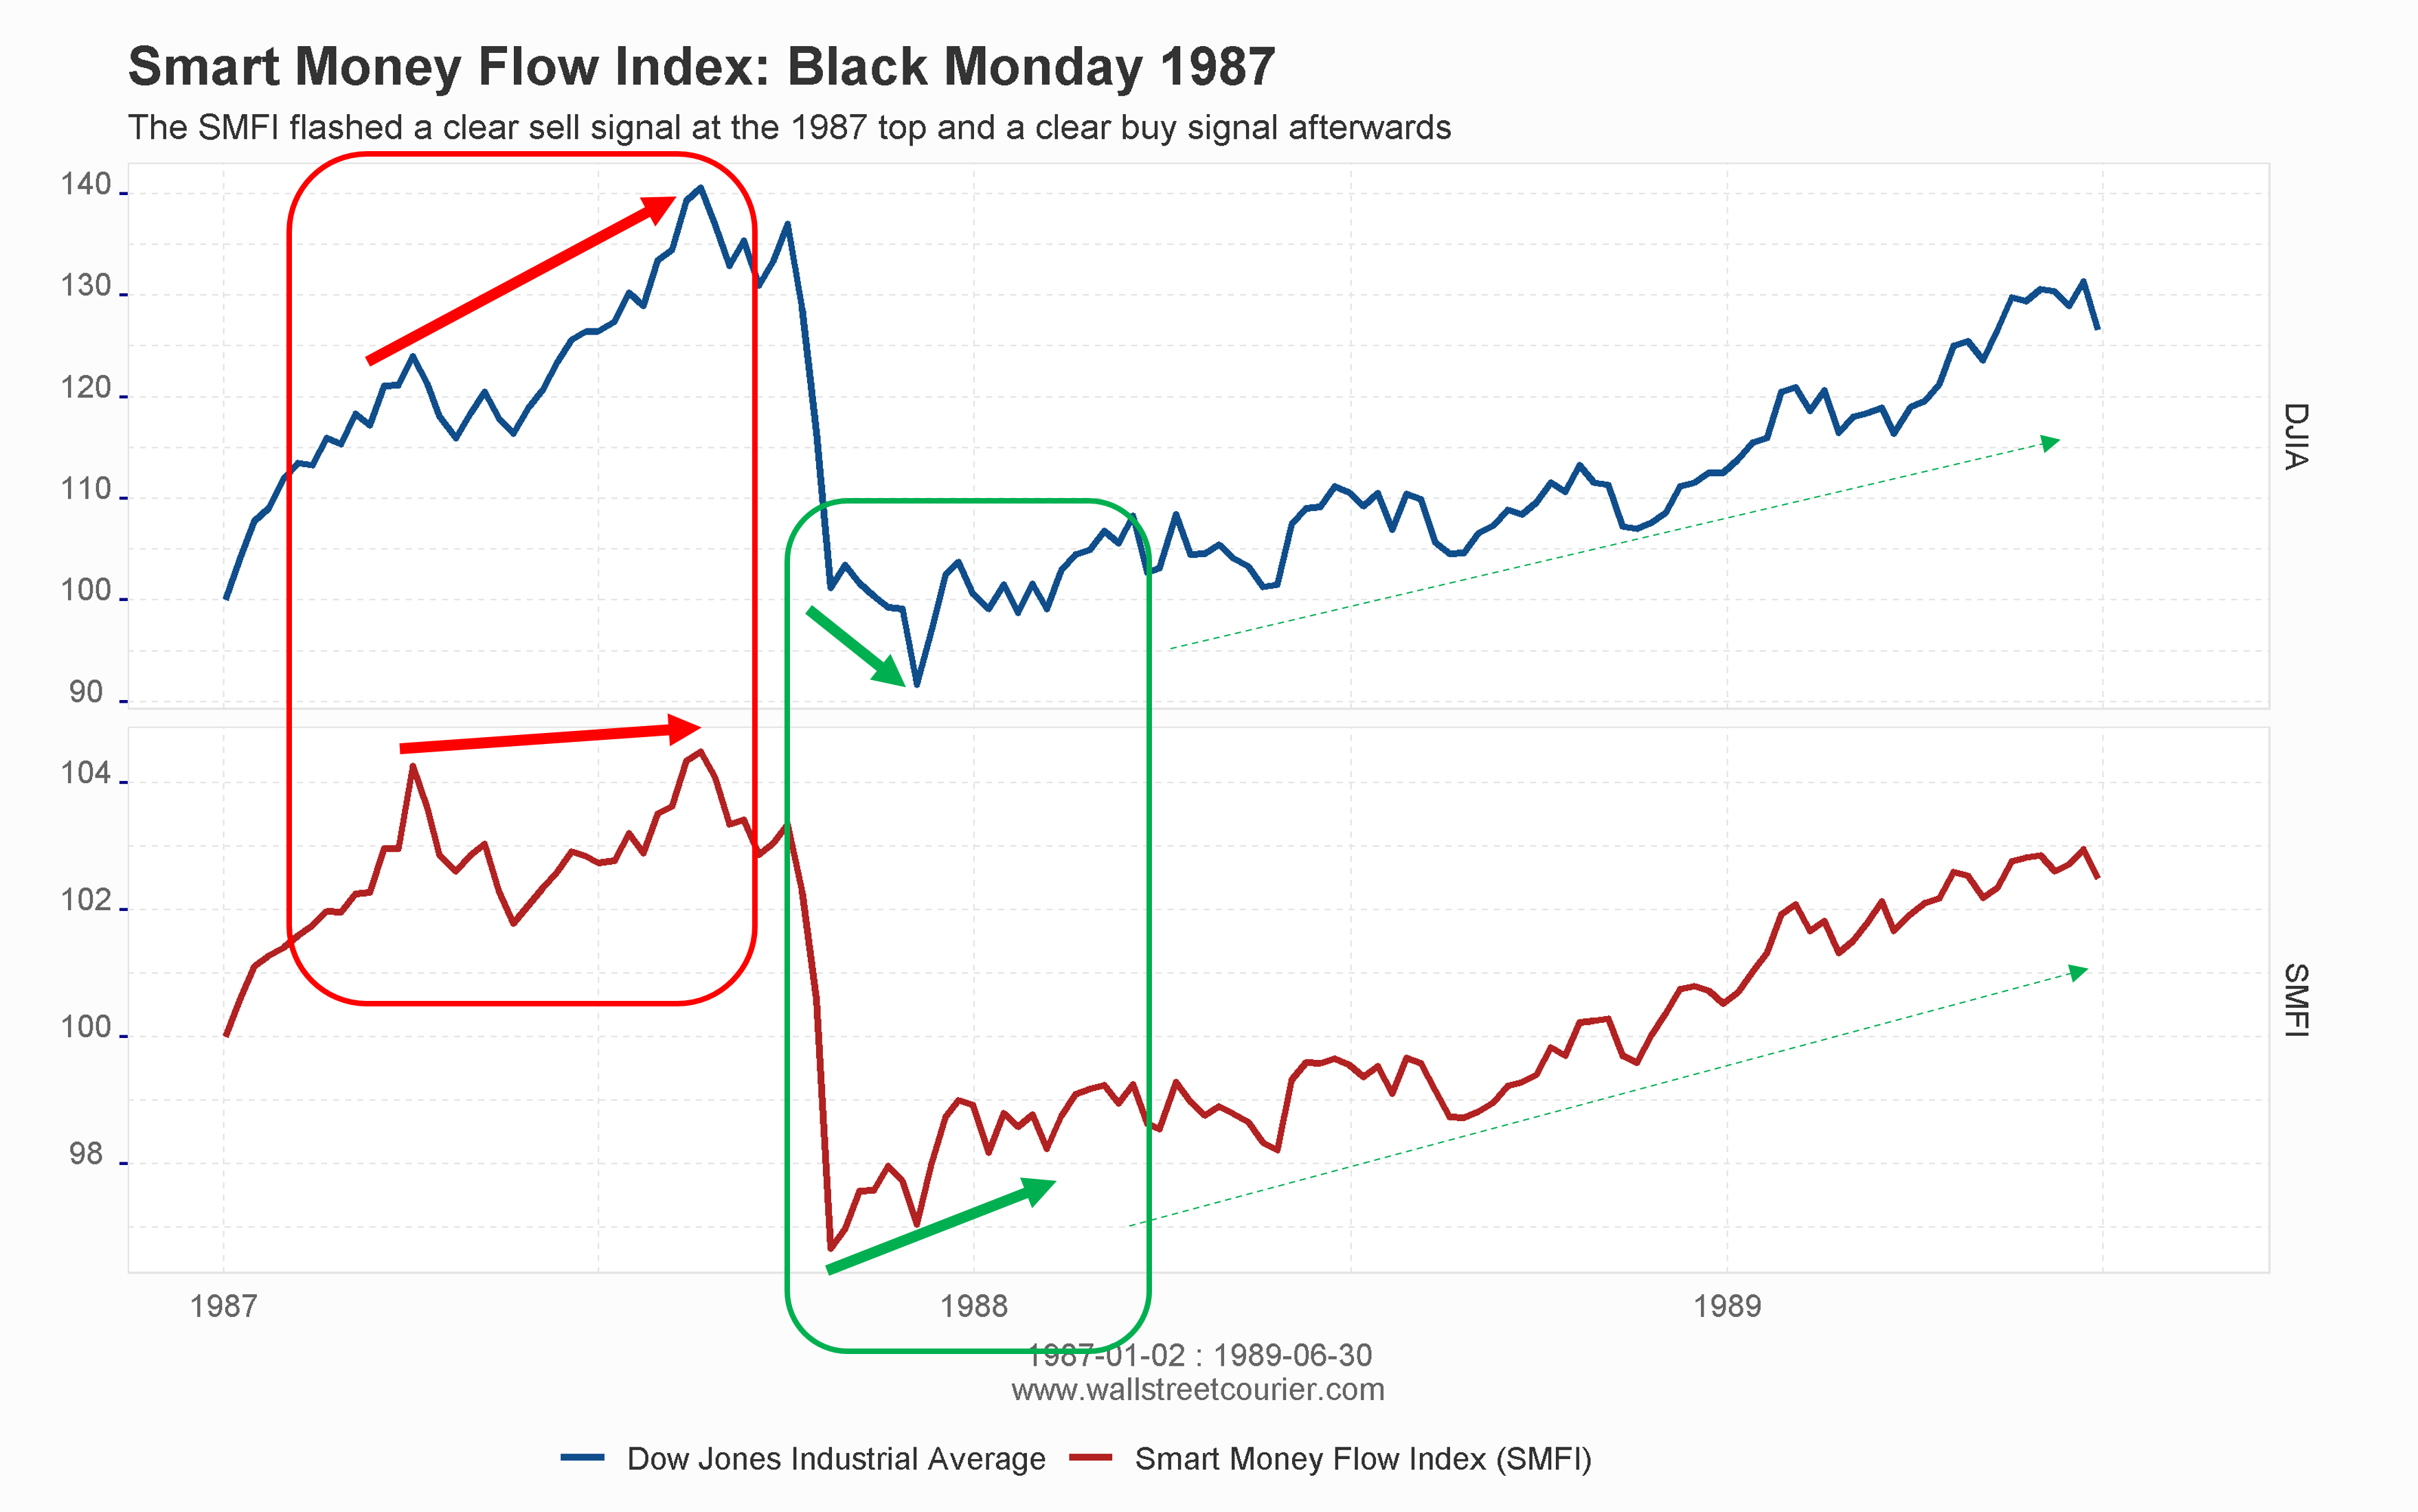
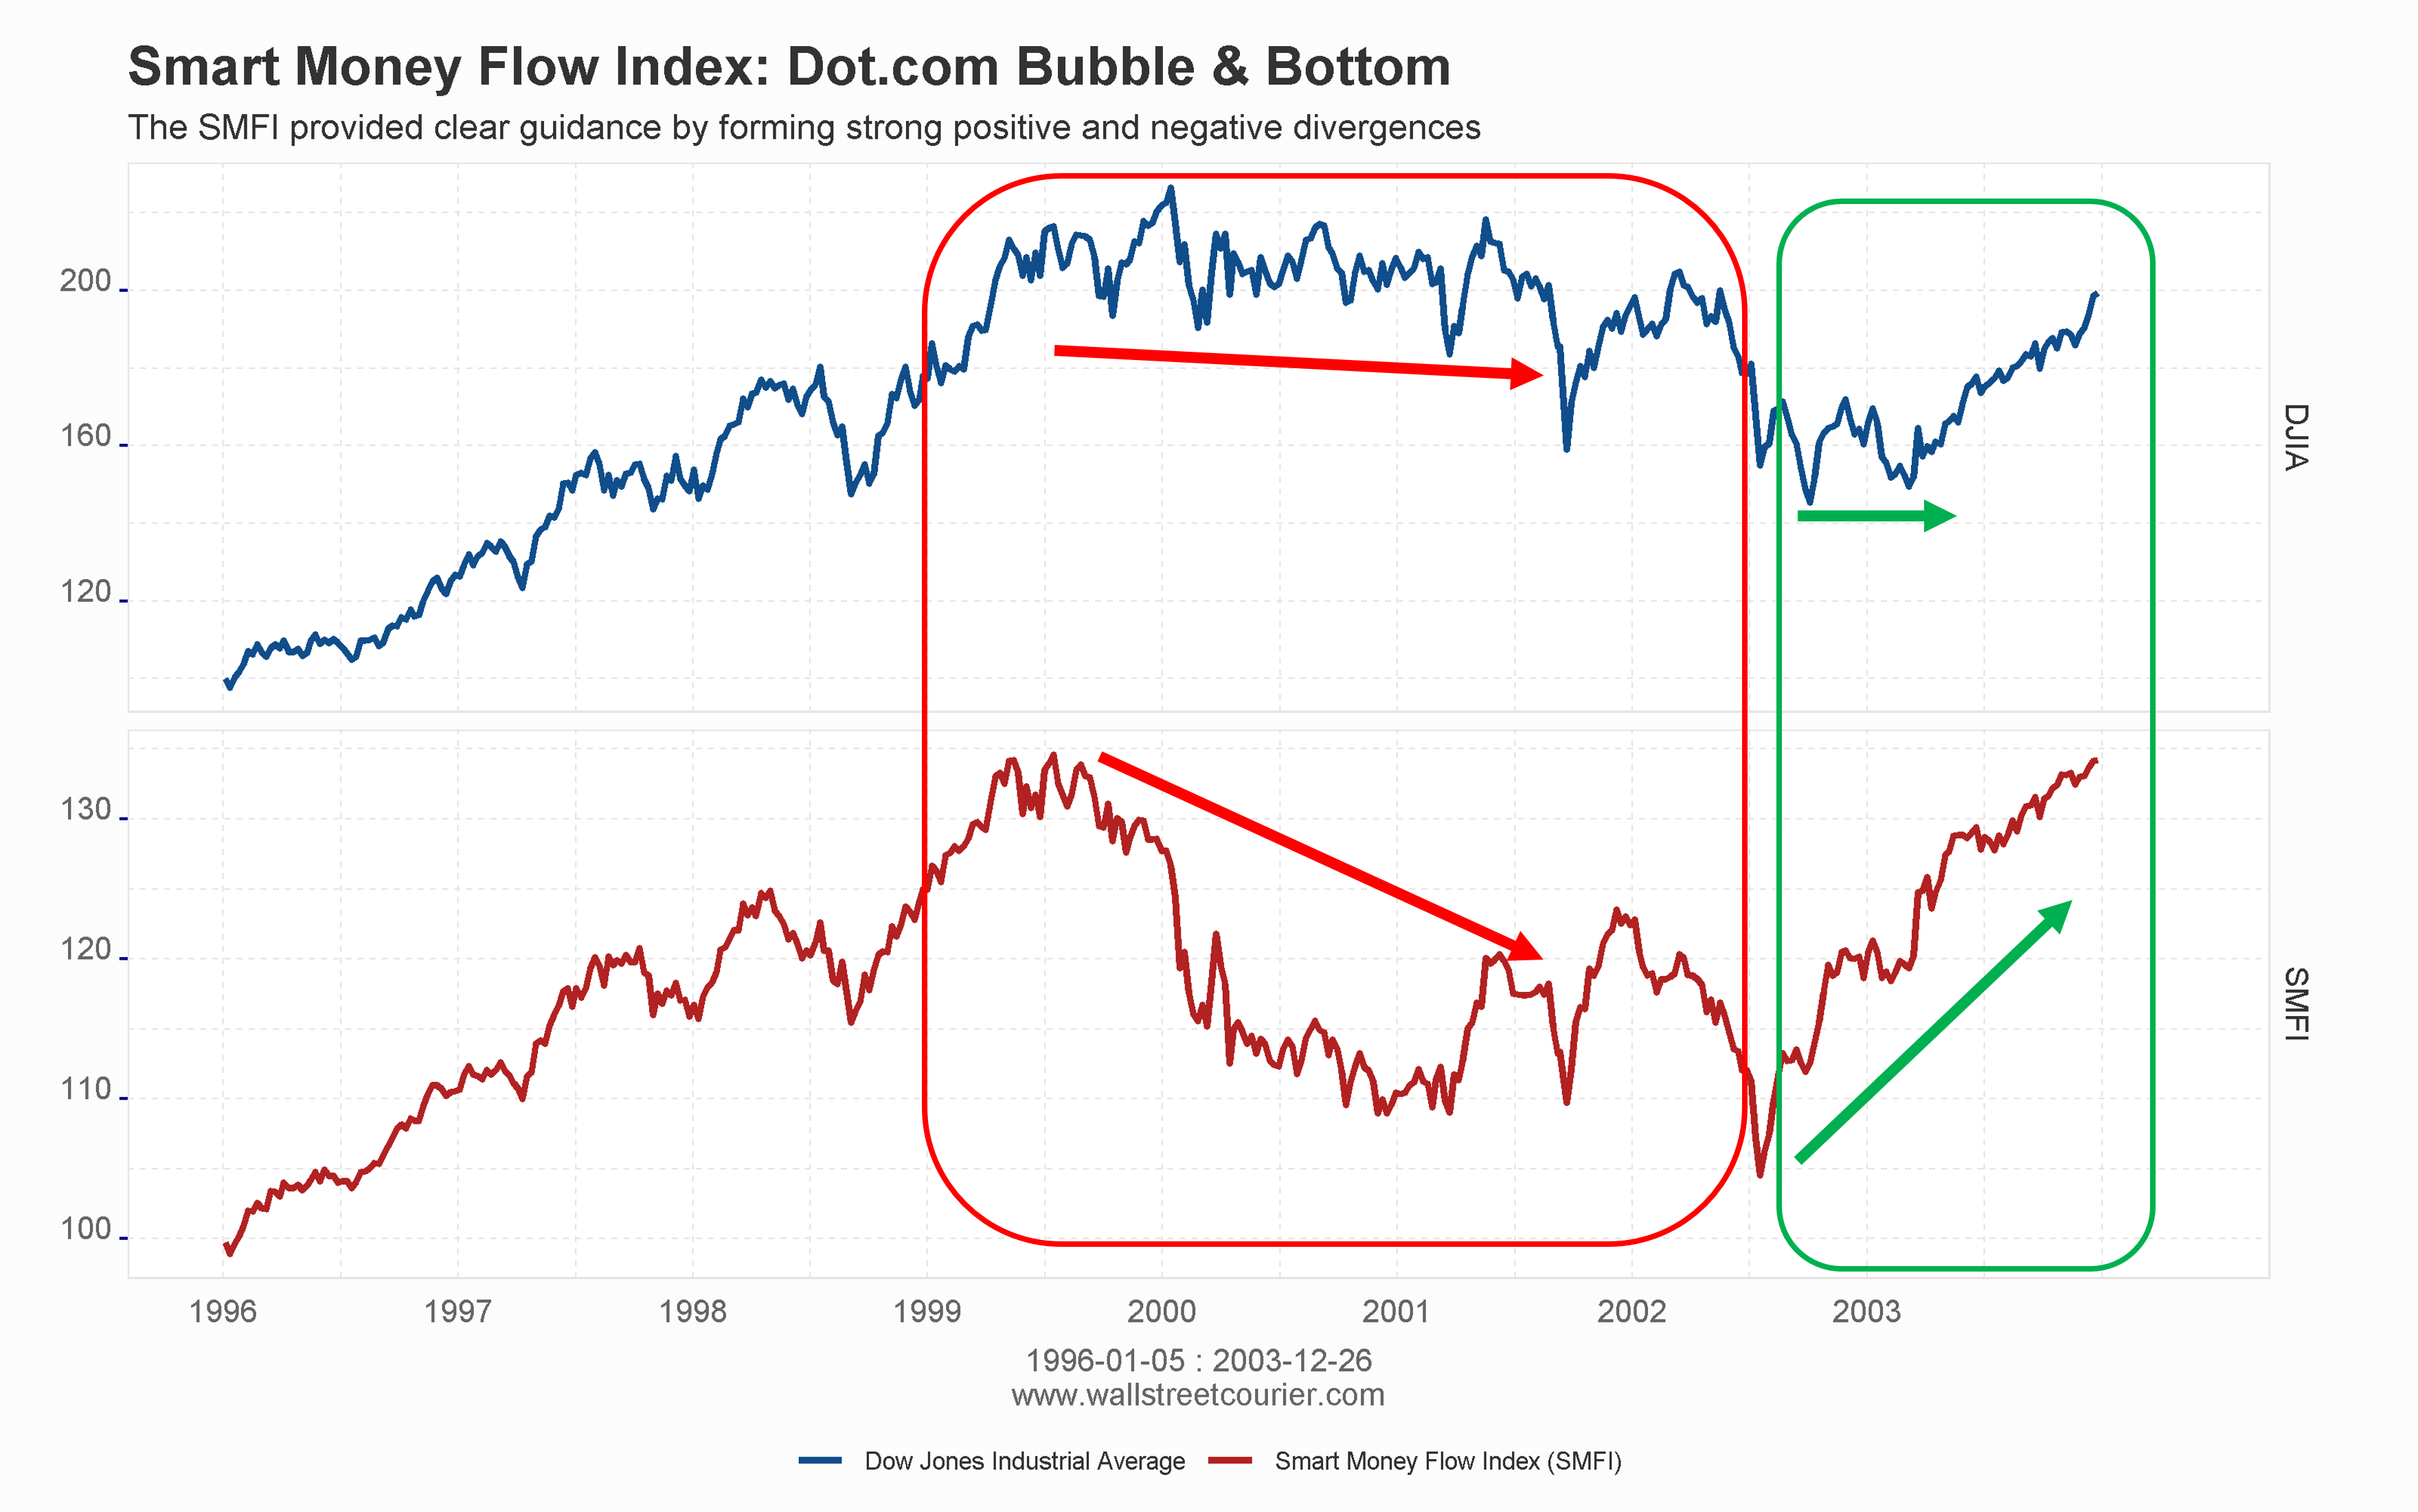
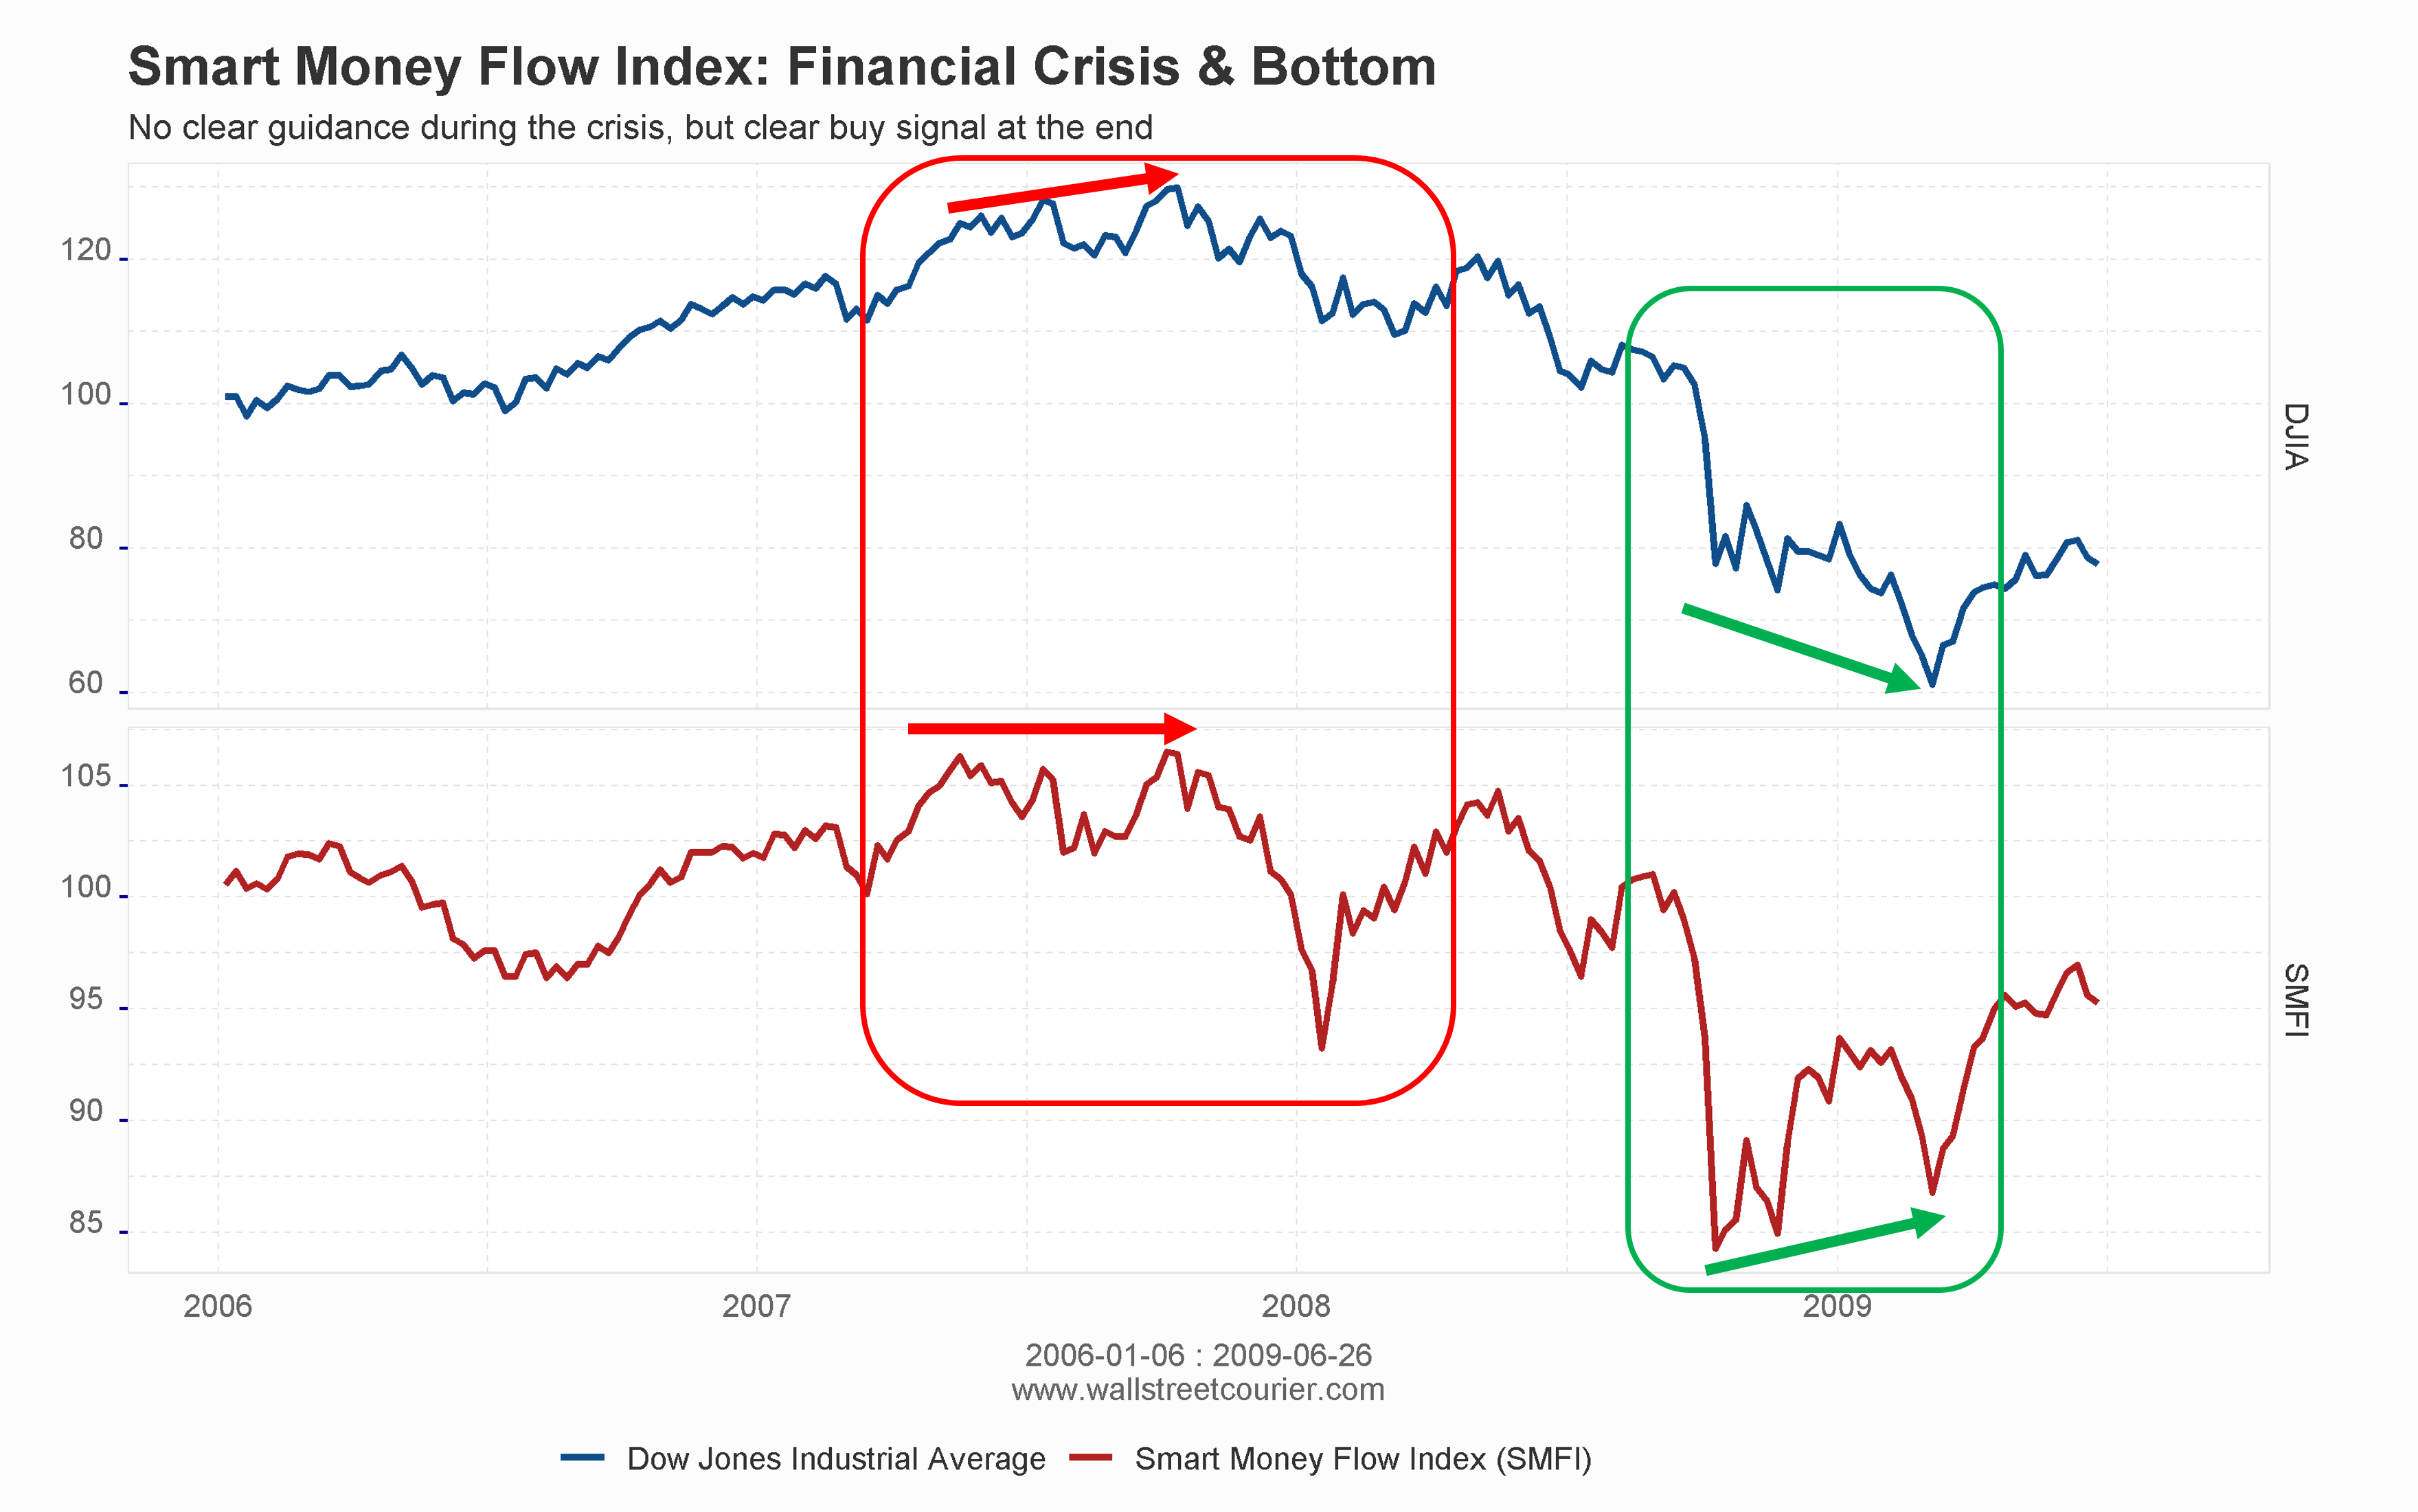
In the examples provided, it is shown that the index was able to send out clear warning signals (by flashing negative divergences to the Dow) before major market crashes, such as the 1987 crash and the dot-com crash of 2000, as well as a correction in 2018. However, it failed to provide a clear indication of a market crash before the financial crisis of 2008 since a significant divergence was hard to spot in the chart before. Nevertheless, the index has mostly been able to form divergences during most major market bottoms, indicating strong institutional buying during these times.
The SMFI flashed a clear sell signal at the 1987 top and a clear buy signal afterwards.
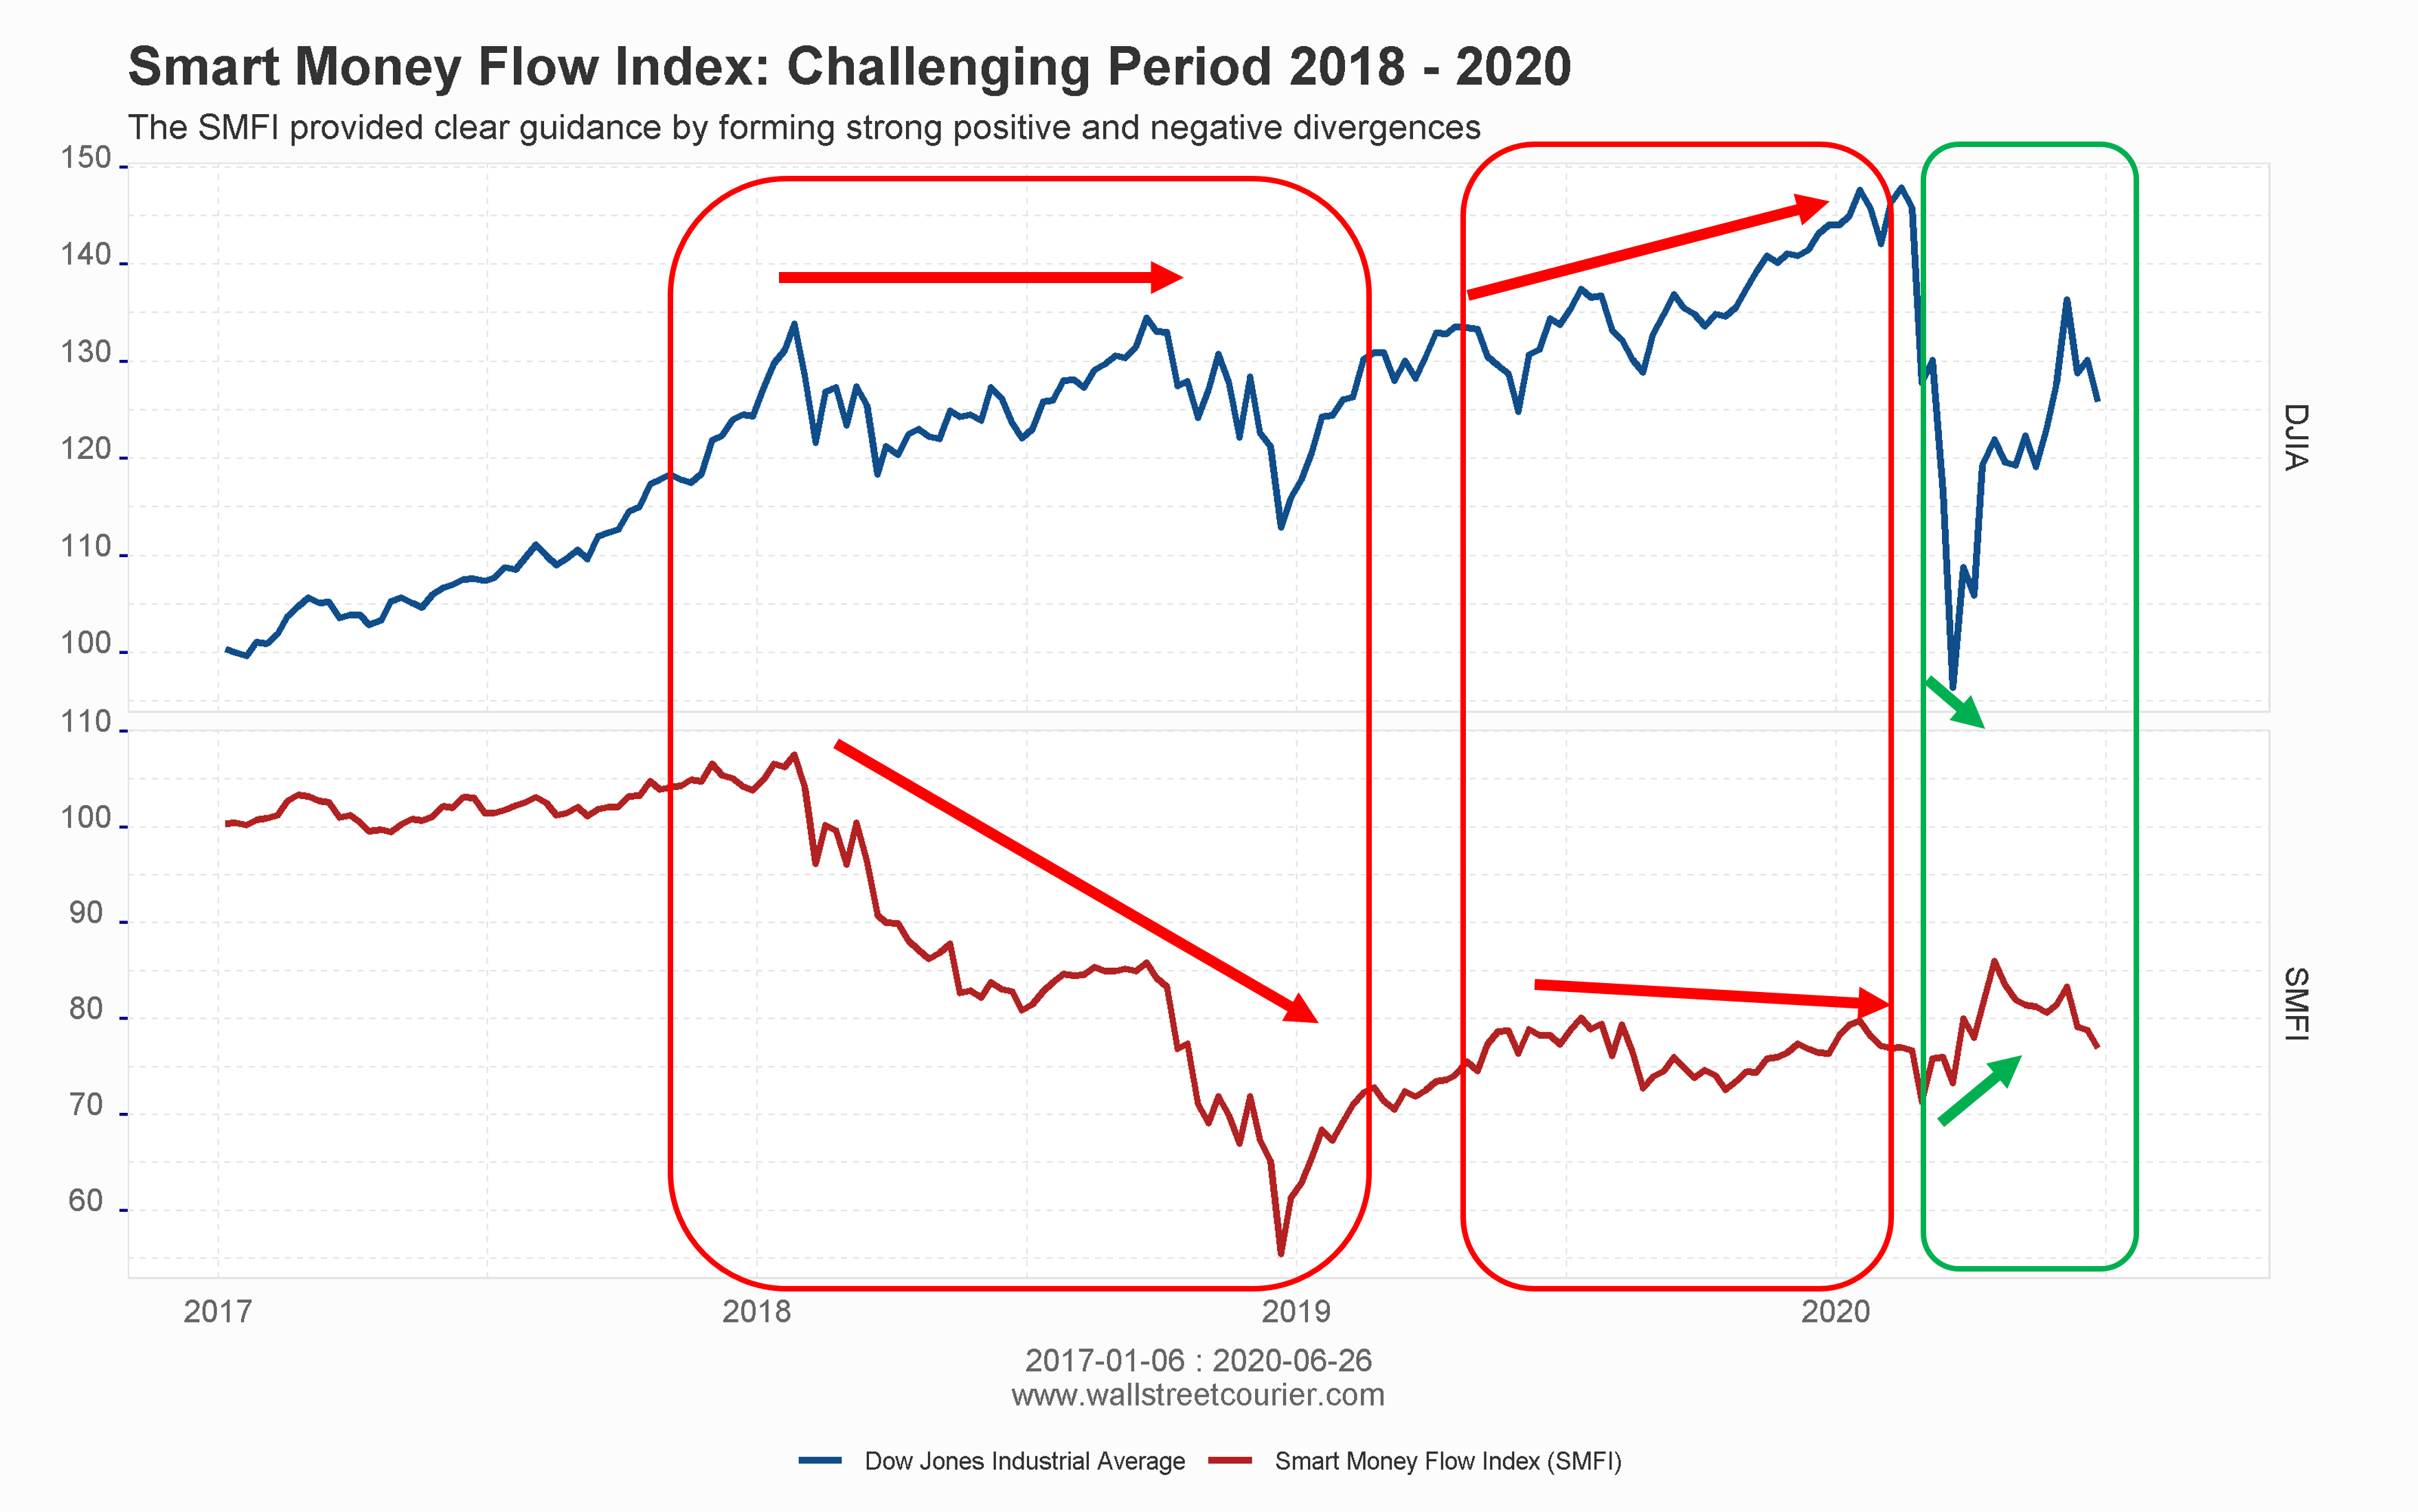
The SMFI provided clear guidance by forming strong positive and negative divergences
Hard to say at the top but clear positive divergence during the final low in March
Effective Signals: Clear divergences
The Smart Money Flow Index (SMFI) is a tool that uses the concept of positive and negative divergences and trend confirmations to track the activity of institutional investors in the stock market. However, this method can be open to interpretation and has been subject to criticism by some experts. To address these concerns, WallStreetCourier developed the WSC Capitulation Index.
The WSC Capitulation Index builds on the formula like the Smart Money Flow Index by uses a mathematical adjustment to derive additional buy and sell signals based on strong divergences. The indicator is calculated by first determining the divergences between the SMFI and the Dow Jones Industrial Average, and then using the Fisher Transformation (a statistical method) to measure the selling pressure caused by Smart Money.
When the WSC Capitulation Index passes above 0.8, it indicates a strong negative divergence between the SMFI and the Dow Jones Industrial Average, which means that Smart Money is outright negatively positioned. On the other hand, when the WSC Capitulation Index drops below 0.8, it indicates a positive divergence between the SMFI and the Dow Jones Industrial Average, which is a clear buy signal as it shows that Smart Money is actively accumulating stocks. Thus, this indicator is an extremely valuable complement to the Smart Money Flow Index helping investors to make more informed trading decisions.
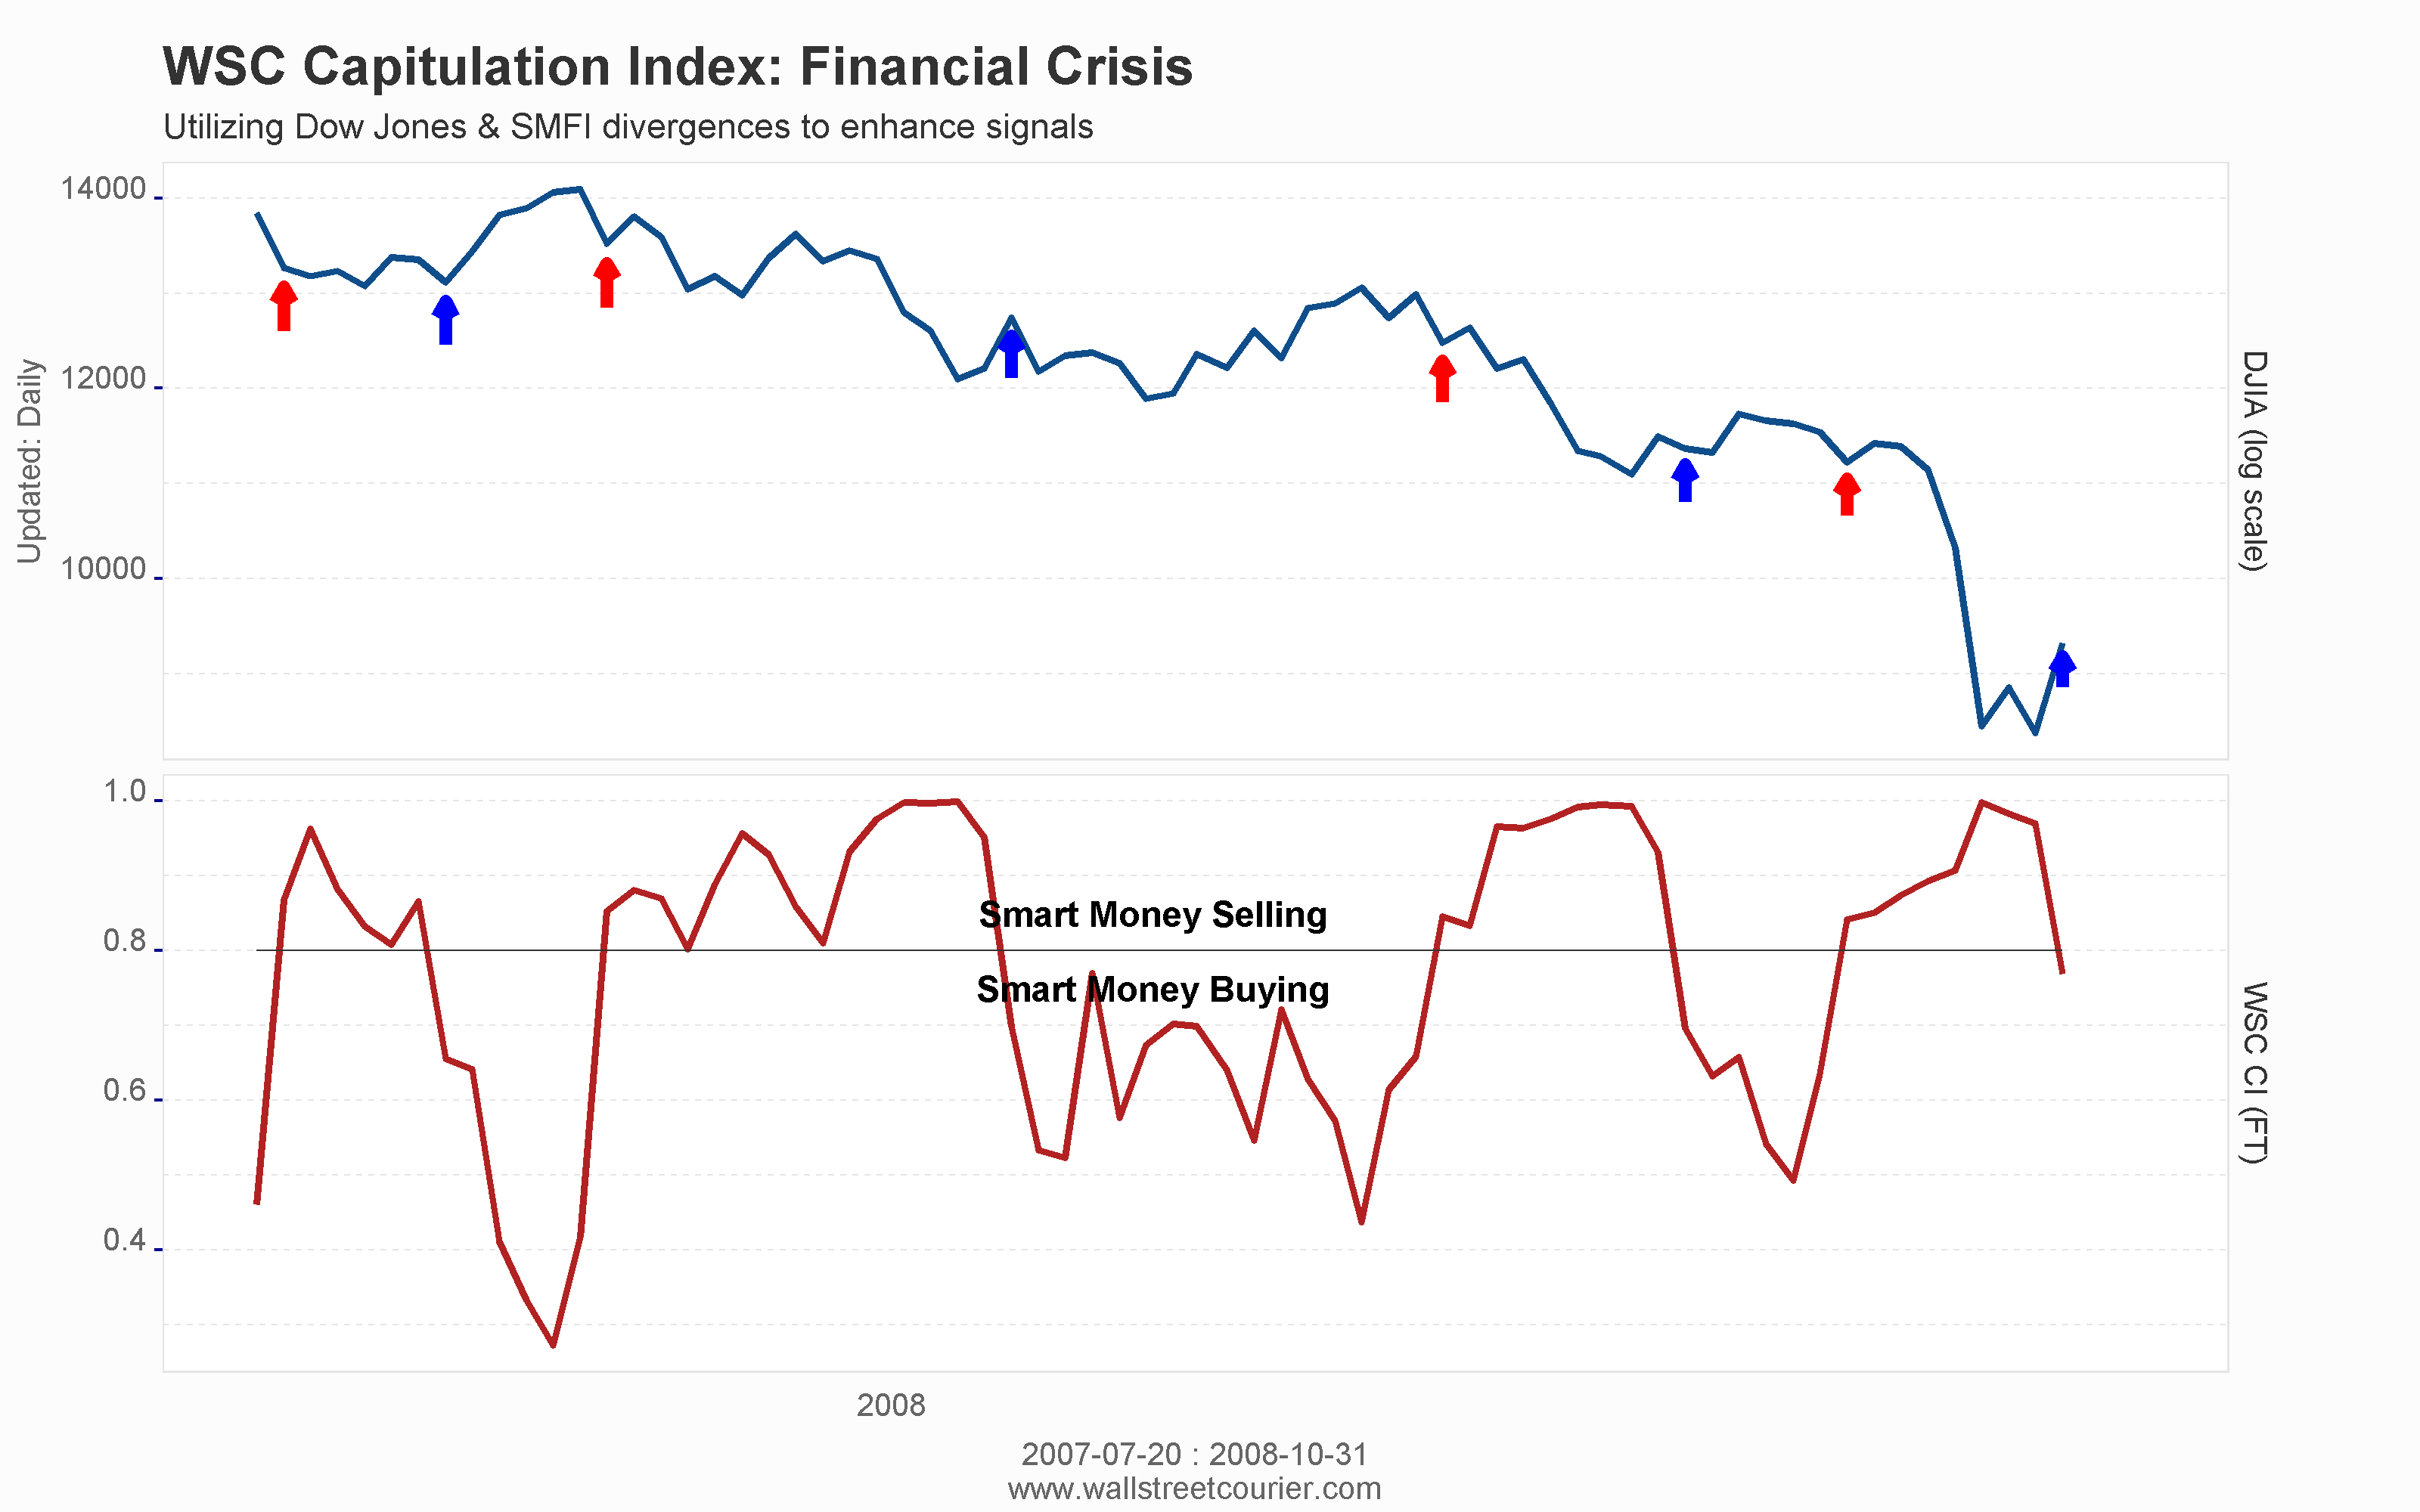
During the 2008 financial crisis, the Smart Money Flow Index (SMFI) struggled to provide clear and easily recognizable chart signals based on divergences between the Dow Jones Industrial Average and the SMFI. However, the WSC Capitulation Index, which uses a mathematical formula to measure when divergences reach a certain positive or negative threshold, was able to extract quite accurate buy and sell signals based on the Smart Money Flow Index.
This is demonstrated in the chart below and is particularly evident in the lead-up to the Lehman Brothers crash in October 2008 when Smart Money was selling heavily into the market (red arrow). Thus, the WSC Capitulation Index serves as a valuable complement to the SMFI, enabling investors to make more informed decisions and fine-tune the readings of the Smart Money Flow Index.
Utilizing Dow Jones & SMFI divergences to enhance signals
As a member of WallStreetCourier, you will have access to exclusive market insights and tools to help you make informed investment decisions. One such tool is the Smart Money Flow Index (SMFI), which is regularly updated on the Bloomberg Terminal under the symbol “SMART GO.” However, as a valued member of WallStreetCourier, you will have access to the SMFI even hours before it is sent to Bloomberg, giving you a head start in understanding the market.
In addition to the SMFI, our subscribers also have exclusive access to the WSC Capitulation Index. This index provides even more precise timing for investments, allowing you to make the most of market opportunities. To learn more about these valuable resources and how they can benefit you as an investor, please click here for more information.
Continue reading: DAX Market Research, Analysis & Outlook: where the DAX stands today, based on smart money flows, trend and sentiment. Updated daily.
You are currently viewing a placeholder content from X. To access the actual content, click the button below. Please note that doing so will share data with third-party providers.
More Information