The Smart Money Flow Index (SMFI) is a market indicator that tracks institutional investor behavior by comparing equity price movements during the opening period of the trading day with price movements near the close. Because retail investors tend to dominate early trading while institutions typically execute orders later in the session, the indicator is designed to isolate the capital flow activity of so-called "smart money" from retail-driven noise.
Unlike sentiment surveys or price-based momentum tools, the SMFI measures where capital is actually moving, not what investors say they believe. It is based on the premise that institutional investors act during specific, predictable windows of the trading day, while retail-driven activity dominates at other times.
The SMFI was developed by R. Koch, founder of WallStreetCourier, and has been an official data provider for the Bloomberg Professional Terminal since 2003, the same terminal used by the world's largest banks, asset managers and institutional investors.
The WSC Smart Money Flow Index is listed on Bloomberg Professional under SMART <Index> <GO>It has been the official data source since 2003, the same terminal used by the world's largest banks, asset managers, and institutional investors.
For the full institutional background and Bloomberg listing details: Smart Money Flow Index on Bloomberg: Institutional Data Source
Markets are not driven by a single homogeneous group of actors. At any given moment, two distinct groups are transacting:
Smart Money refers to institutional participants: large banks, hedge funds, pension funds and professional asset managers with large capital bases, dedicated research teams and long time horizons. They execute large orders strategically, typically during less liquid windows to minimize market impact. Their moves are deliberate and data-driven.
Dumb Money refers to retail-driven activity that tends to be emotionally reactive and concentrated around market open and news events. This group tends to buy into strength and panic-sell into weakness.
The divergence between these two groups is highly informative. When institutional investors accumulate while retail investors are selling, a pattern the SMFI is designed to detect, it has historically preceded significant market recoveries. The reverse is equally true.
The SMFI is related to, but distinct from, other sentiment tools such as the Put/Call Ratio, which measures options positioning, and the AAII Sentiment Survey, which tracks retail investor surveys. Each captures a different dimension of market behavior. Within the WSC Market Health Score, these indicators are read together for a more complete picture.
The SMFI is built on a well-documented behavioral pattern in equity markets:
The opening 30 to 60 minutes of each trading session are dominated by retail order flow, reactive to overnight news, earnings, and geopolitical headlines.
The final 30 to 60 minutes tend to reflect institutional repositioning: more deliberate, less emotional, and more likely to reflect informed views on the underlying market.
By comparing price action in these two windows and adjusting for index-level moves across the full session, the SMFI constructs a daily reading of institutional sentiment. The cumulative value over time reveals whether large capital is systematically accumulating or distributing.
Price change during the first 30–60 minutes (retail-dominated window) is subtracted from the daily reading.
Price change during the final 30–60 minutes (institutional window) is added to the daily reading.
The result accumulates over time to produce a cumulative index that reveals the trend of institutional capital flow.
The SMFI is most useful in relation to the price action of the underlying index. The four key scenarios are:
| SMFI Direction | Index Direction | Interpretation | Signal |
|---|---|---|---|
| Rising | Rising | Confirmation. Smart money participating in the rally. | Bullish |
| Rising | Falling | Accumulation into weakness. Institutions buying while retail sells. Historically one of the strongest forward-looking bullish signals. | Strong Bullish |
| Falling | Rising | Distribution into strength. Smart money reducing exposure while retail drives prices higher. Warning signal for the rally's sustainability. | Warning |
| Falling | Falling | Confirmation of downtrend. Smart money not stepping in to buy. Risk-off environment. | Bearish |
The most actionable scenarios are the middle two, where the SMFI and price action diverge. The key word is sustained. A single-session divergence carries little weight. It is the multi-week or multi-month trend of the SMFI relative to price that carries analytical significance.
Access daily SMFI signals for 11 global markets, hours before Bloomberg publication.
View PlansThe following charts show how the SMFI behaved across four major market episodes.
In the months before the October crash, the SMFI began declining while the DJIA continued rising, forming a clear negative divergence that indicated institutional distribution into retail-driven strength. After the crash, the pattern reversed: the SMFI turned upward while the index remained depressed, signaling institutional accumulation at distressed prices. The subsequent multi-year recovery followed.
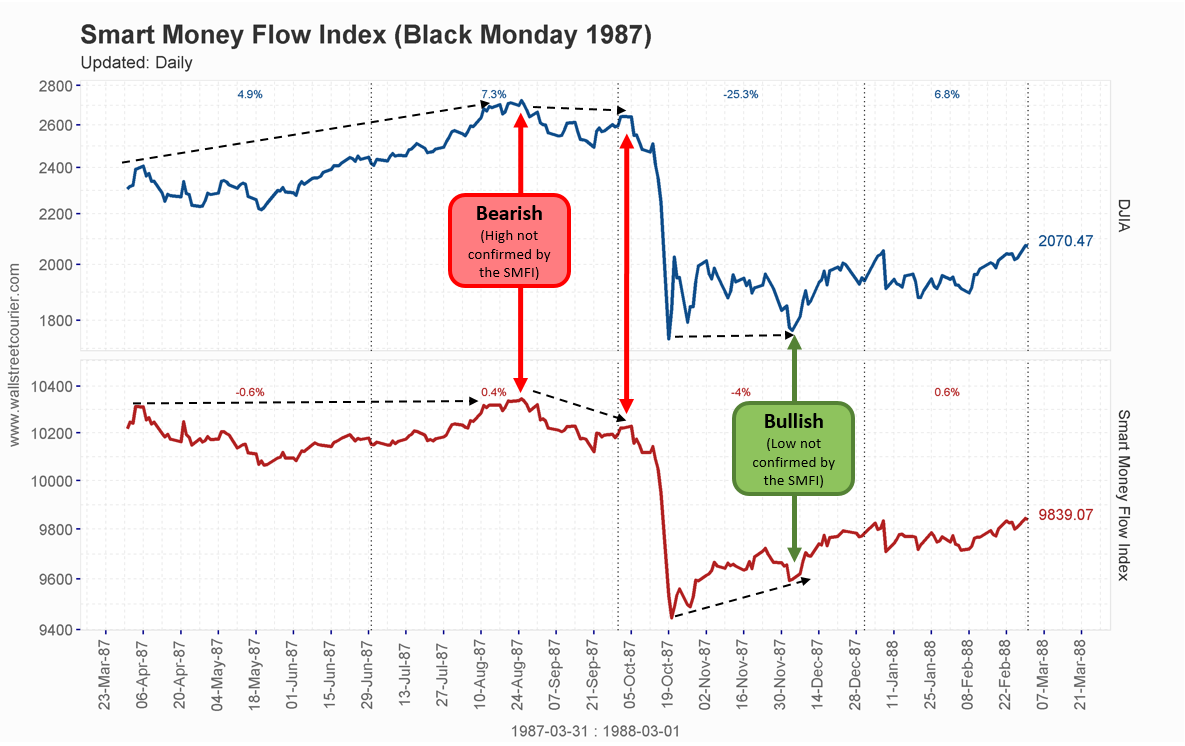
Smart Money Flow Index: Black Monday 1987. Negative divergence before the crash, positive divergence signaling the buy opportunity after.
During the dot-com bubble, the SMFI provided a sustained warning signal. While the DJIA continued climbing through the late 1990s, the SMFI was already declining, reflecting institutional distribution into a retail-driven speculative rally. This was a multi-year negative divergence. At the bear market bottom in 2002 to 2003, the pattern reversed sharply: the SMFI turned strongly upward while the index remained near its lows, confirming institutional accumulation before the subsequent recovery.
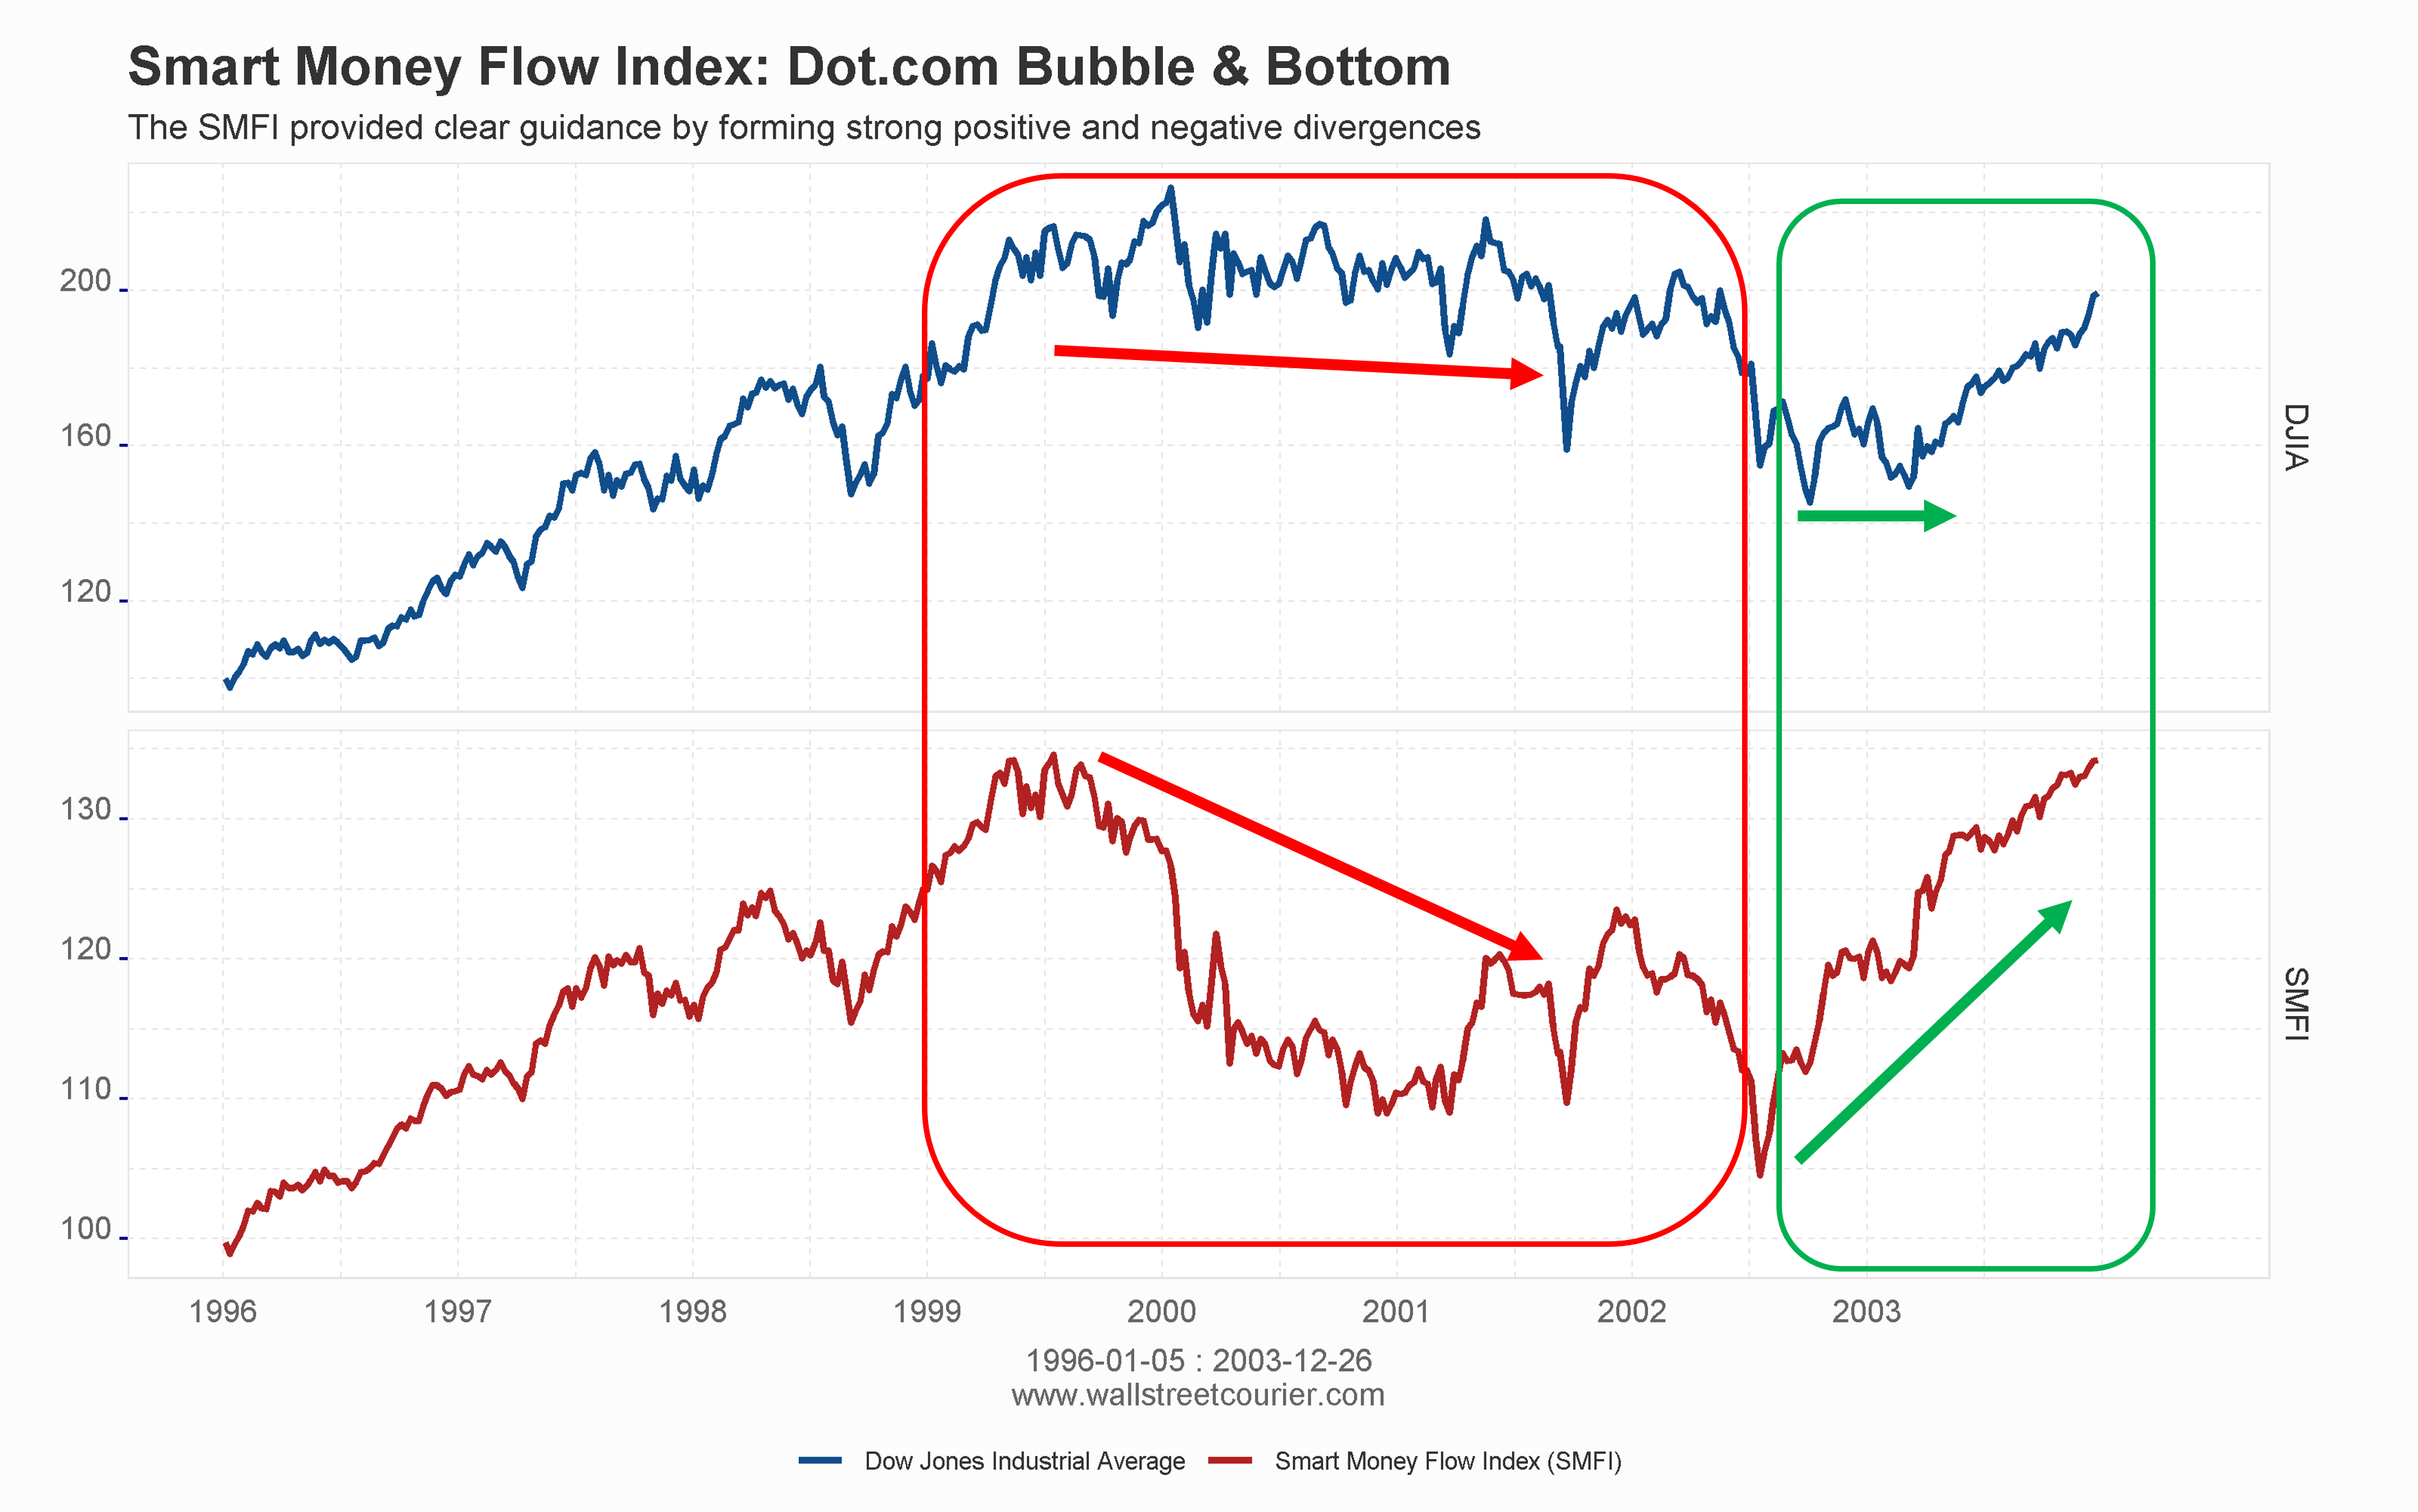
Smart Money Flow Index: Dot-com Bubble and Bottom (1996 to 2003). Multi-year negative divergence during the bubble, strong positive divergence at the bottom.
During the acute phase of the 2008 financial crisis, the SMFI did not provide clear directional guidance. The extreme dislocation in institutional behavior during a systemic liquidity event disrupted the normal patterns the indicator is designed to track. This is a known limitation, documented transparently. Where the SMFI did provide value was at the 2009 market bottom: as the DJIA made its lows, the SMFI began recovering ahead of price, signaling institutional re-accumulation before the index confirmed the turn. The subsequent decade-long bull market followed.
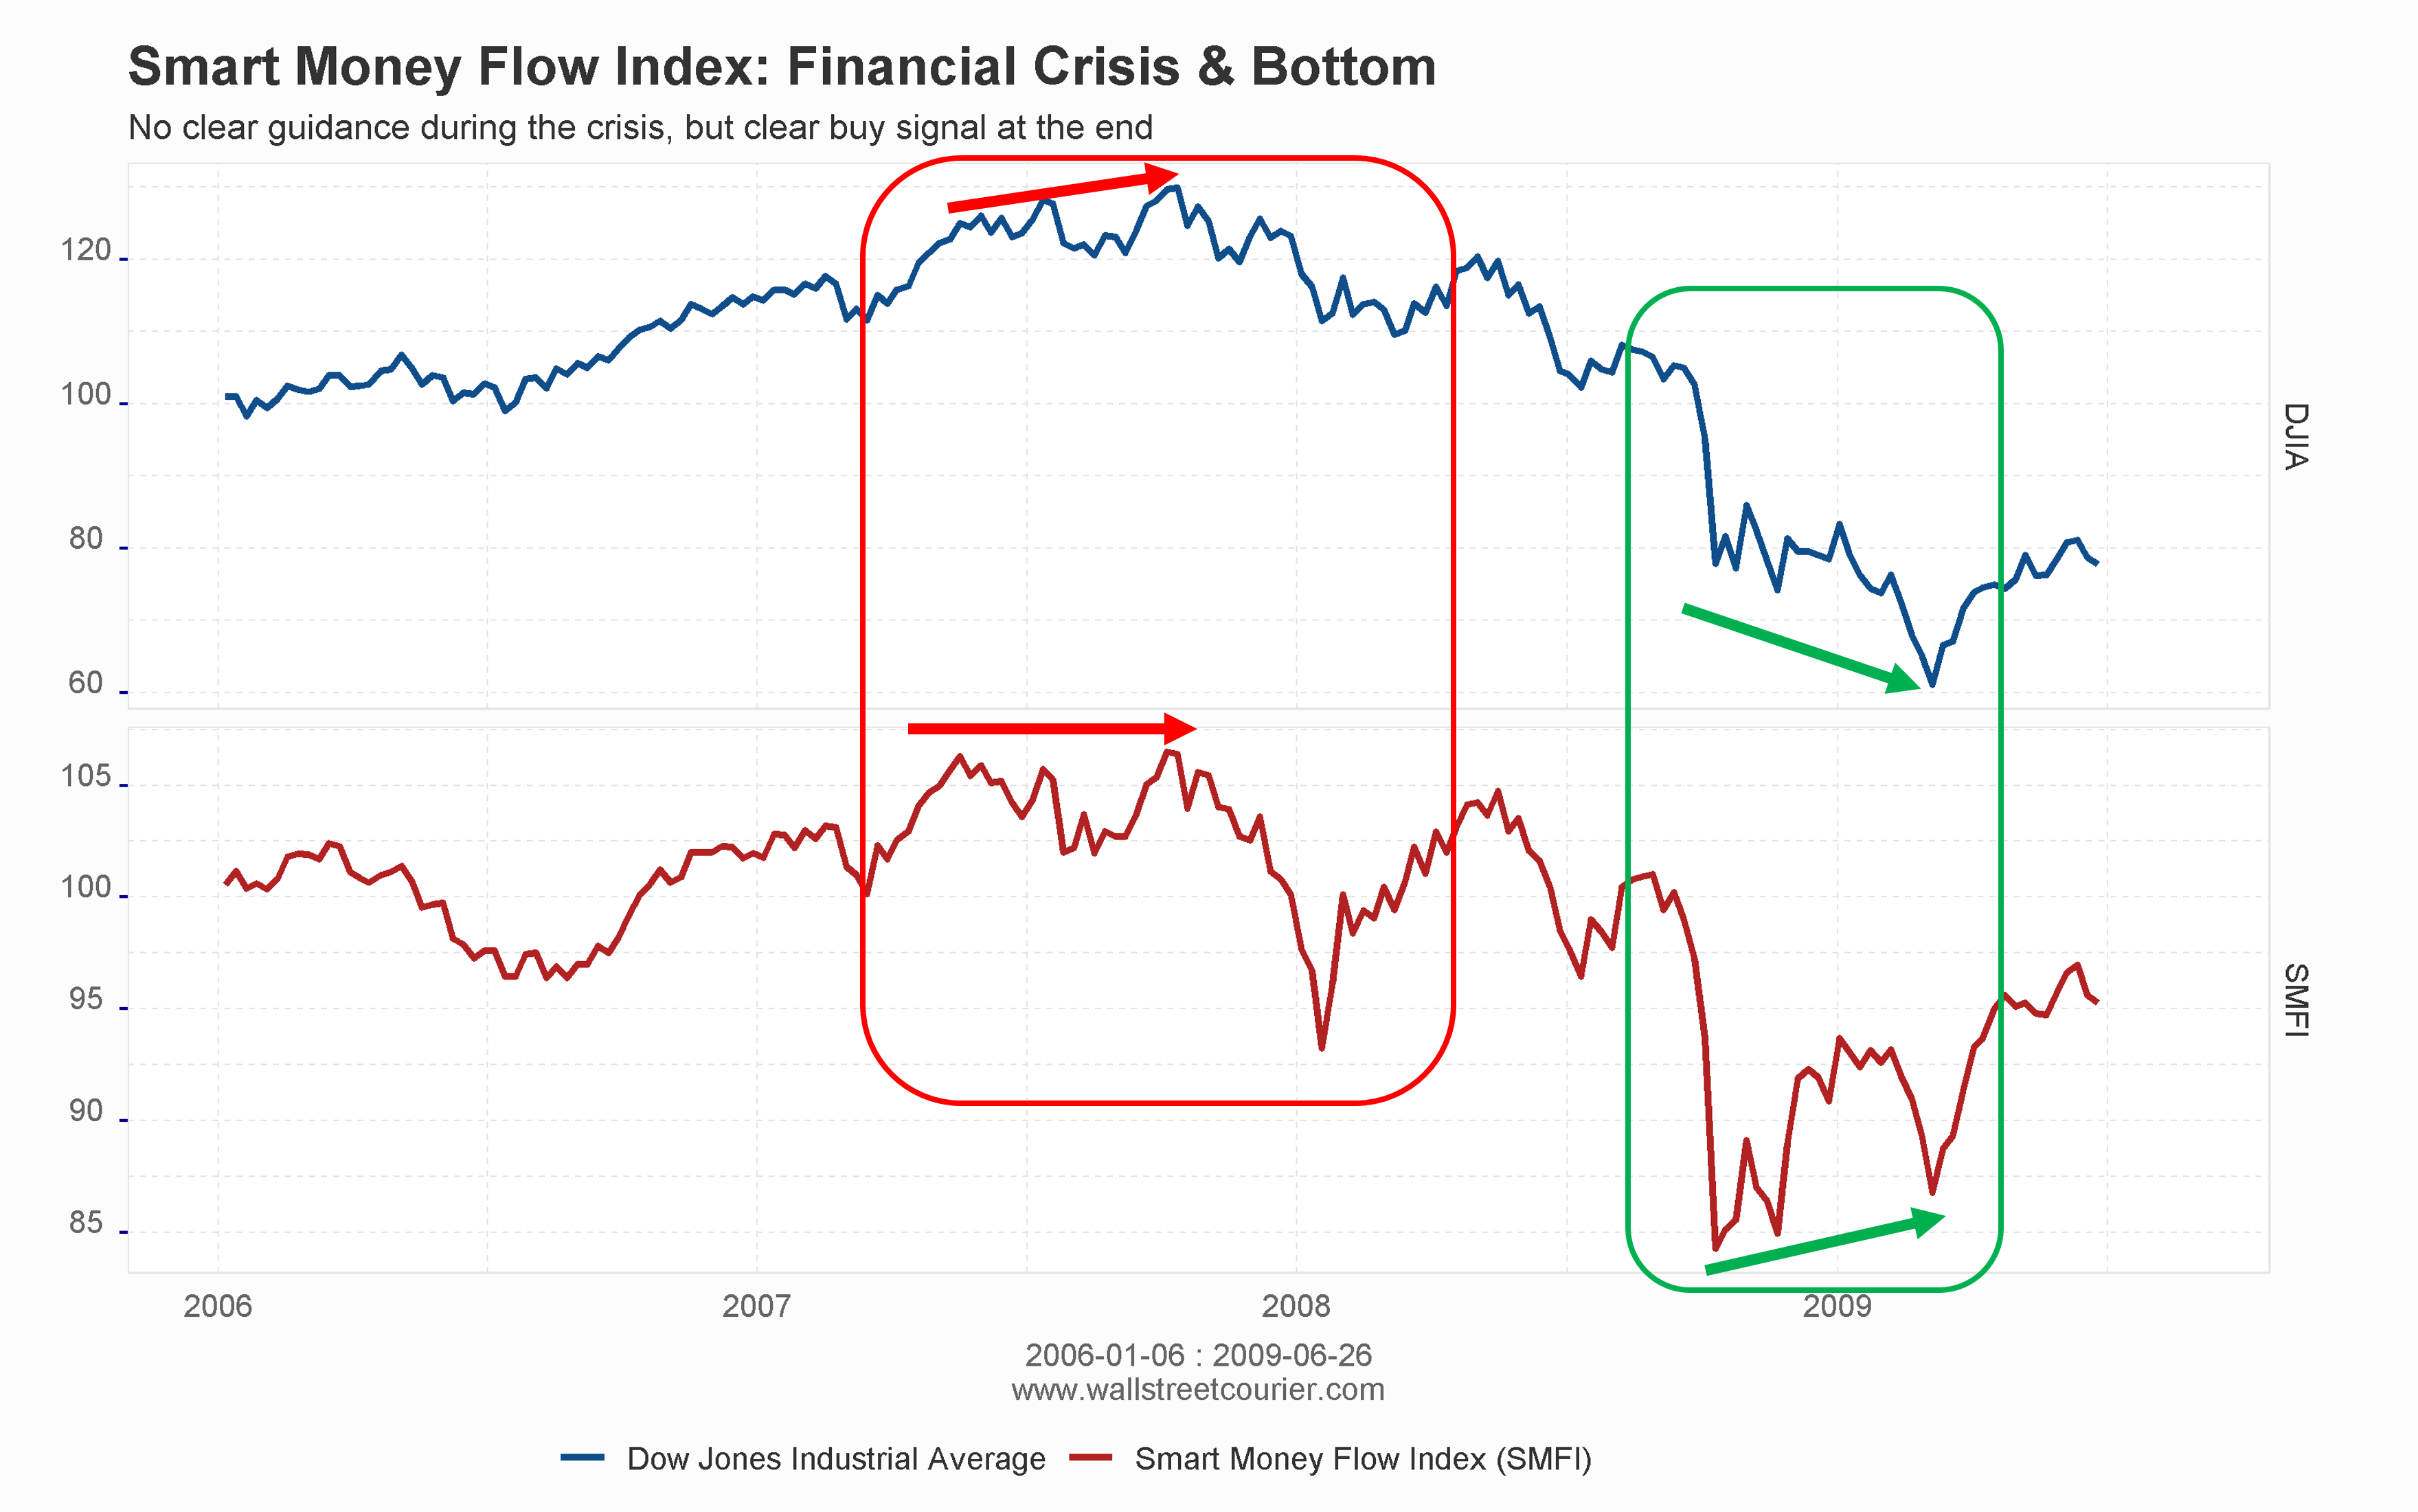
Smart Money Flow Index: Financial Crisis and Bottom (2006 to 2009). Limited guidance during the crisis; clear buy signal at the 2009 market bottom.
In 2018, the SMFI began declining while the DJIA remained elevated, a negative divergence that anticipated the sharp Q4 2018 correction. During the 2019 recovery, the SMFI remained subdued even as the index reached new highs, a second warning that persisted into early 2020. When the COVID crash arrived, the SMFI dropped sharply but then recovered ahead of the index, generating a positive divergence signal at the lows. The subsequent sharp recovery followed.
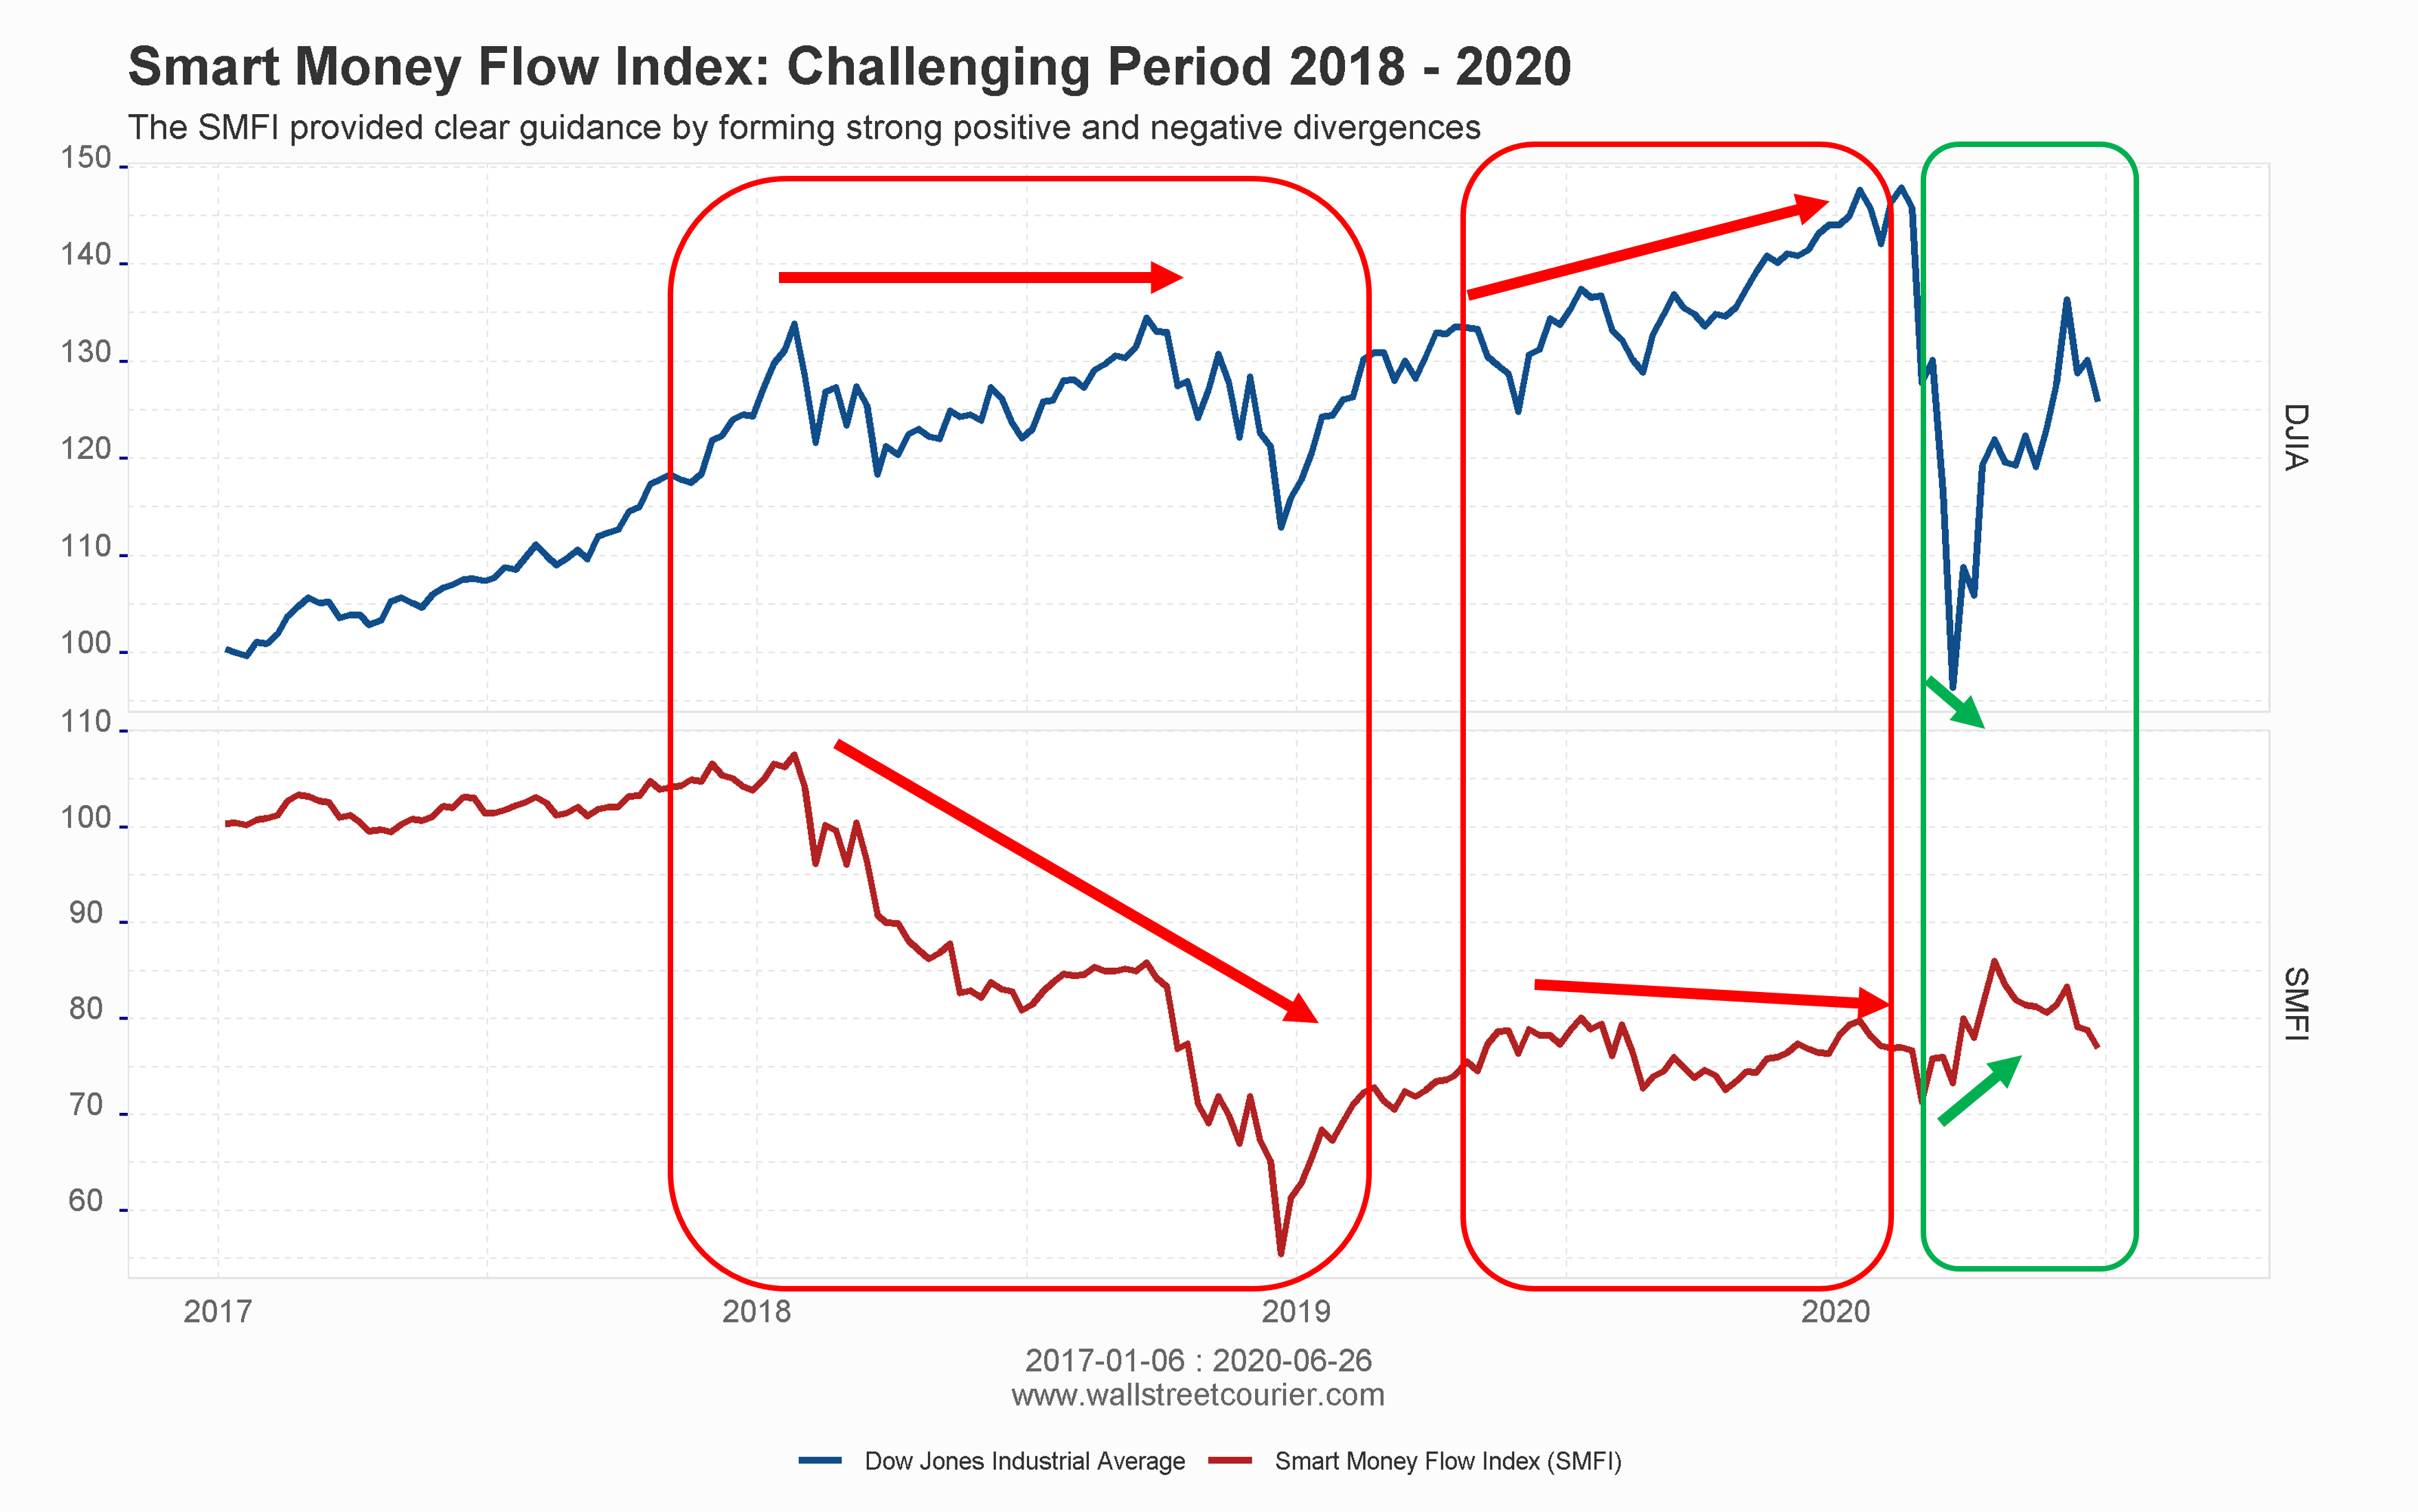
Smart Money Flow Index: Challenging Period 2018 to 2020. Two negative divergence warnings, followed by a positive signal at the COVID crash low.
Historical signal descriptions are based on WallStreetCourier's documented live SMFI publication record since 1999. Past indicator performance does not guarantee future accuracy.
"Smart Money Flow Index" is a trademarked term. Nevertheless, occasionally indicators appear using the same terminology. The WSC Smart Money Flow Index is the original: calculated and published continuously since 1999, listed on Bloomberg Professional since 2003, and integrated into a broader market regime framework used by investors in 50+ countries.
When evaluating any indicator that carries this name, ask: How long has it been published live, without interruption? Is it independently validated by a third party? Is it part of a coherent analytical system, or a standalone signal?
The SMFI is one of several sentiment tools used within the WSC framework. Understanding how it differs from related indicators clarifies when each is most useful:
| Indicator | What It Measures | Relationship to SMFI |
|---|---|---|
| WSC SMFI | Institutional equity capital flow via intraday price pattern analysis | The primary institutional flow signal in the WSC sentiment layer |
| Put/Call Ratio | Options market positioning as a sentiment proxy | Complementary: measures sentiment expectations, not actual equity flow |
| AAII Sentiment Survey | Self-reported retail investor bullishness/bearishness | Complementary: measures stated sentiment, not capital movement |
| VIX | Implied volatility and fear in options markets | Risk overlay: useful for context but does not track directional flow |
Within the WSC Market Health Score, these indicators are read together rather than in isolation. The SMFI carries particular weight because it measures actual capital movement, not sentiment surveys or derivatives positioning.
Within WallStreetCourier, the SMFI does not operate in isolation. It is one component of a broader Market Health Score, a composite indicator that aggregates three dimensions for each market:
Price-based directional indicators: EMA, MACD, Trend Trader Index. Establishes the directional foundation of the regime. Necessary but not sufficient on its own.
Breadth and participation metrics: Advance/Decline, percentage of stocks above key moving averages, New Highs vs. New Lows. Filters whether price trends are supported by broad participation or driven by a narrow group.
The SMFI functions as the institutional capital flow component of the sentiment layer. It can shift the Market Health Score before price action confirms a move, making it one of the more forward-looking inputs in the framework. Read alongside the Put/Call Ratio and AAII Sentiment data for a complete picture.
The resulting Market Health Score (0 to 100%) feeds directly into WSC's Market Regime Classification, a six-zone framework ranging from Very High Reward to Very High Risk. This is the output members use to make allocation decisions.
Within WallStreetCourier, the SMFI is integrated into a structured daily process that takes approximately 5 to 15 minutes:
Check the DJIA/SMFI chart in the global market overview for any active divergences. This is where the raw SMFI signal is visible as a standalone chart with full historical context.
Review the SMFI signal status for your markets of interest alongside other indicator inputs. The briefing surfaces any meaningful changes in SMFI behavior since the prior session.
The Market Health Heatmap shows where the SMFI sits within the broader sentiment layer across multiple markets simultaneously, color-coded for rapid assessment.
SMFI input contributes to the Market Health Score, which determines the current regime zone (Very High Reward through Very High Risk) and generates the action signal for each covered market.
Aggregates all information into a concise daily updated research report. The SMFI's contribution is visible as one component of the Market Health Score breakdown.
SMFI + Market Regime Framework + ETF Model Portfolios, one platform, 29 global markets.
Register Free, No Credit CardNo single indicator is a complete market timing tool, and the SMFI is no exception. Understanding its limitations is part of using it correctly:
The SMFI is calculated daily and available within the WallStreetCourier platform for 11 major global indices. Each market has its own SMFI time series, updated daily. The DJIA dataset is the same one officially listed on the Bloomberg Professional Terminal since 2003.
The Smart Money Flow Index has been referenced and cited in major financial media since its Bloomberg listing in 2003. These citations reflect the SMFI's standing as a recognized institutional capital flow indicator within the broader financial research community, not promotional placements.
| Publication | Title / Context |
|---|---|
| Bloomberg | Smart Money Buying Stocks Shows S&P 500 Rally Has Legs |
| Bloomberg | Don't Buy the Stock Rally? The Smart Money Does |
| Bloomberg | Powell Shows Markets He Won't Be Rattled by Volatility |
| Bloomberg | Chart of the Day: Smart Money Flow Index nominated by Bloomberg Professional |
| MarketWatch | The 'smart money' index is doing something unusual right now |
| Barron's | Interview with market pro Don Hays about the Smart Money Flow Index |
| Financial Post | Follow the Smart Money to beat the market |
Daily SMFI signals for 11 global equity markets, hours before Bloomberg publication. Integrated with Market Regime Classification and Market Health Score across 29 markets. One market per week free, no credit card required.
The Smart Money Flow Index is a daily, quantitative measure of institutional capital flow in major equity indices. Developed by WallStreetCourier founder R. Koch and officially listed on Bloomberg Professional since 2003, it tracks the divergence between institutional and retail behavior, specifically the tendency of large, informed capital to accumulate or distribute during predictable windows in the trading session.
Despite the proliferation of indicators using similar names, the WSC SMFI remains the original: the only version with a continuous live track record since 1999, Bloomberg validation, and integration into a complete market regime framework covering 65 global markets.
For investors who want to align their positioning with institutional capital rather than react to retail noise, it is one of the most direct tools available on the platform.
You are currently viewing a placeholder content from X. To access the actual content, click the button below. Please note that doing so will share data with third-party providers.
More Information