Since Markowitz, portfolio diversification is one of the most recommended and well known investment strategies among the financial industry.
In general, diversification is an investment strategy which should reduce risk within a portfolio by investing in different securities. If a price of a security does not move in the same direction like other stocks within the portfolio, a price decrease in that stock can be offset by a price increase in a different stock. For that reason, the volatility (risk) of the entire portfolio is limited although the expected returns of each security and thus the expected return of the portfolio remain unchanged.
However, diversification is only suitable to reduce/eliminate unsystematic risk (company specific risks like losing the market leadership, lack of innovation etc.) while the systematic risk (changes in the macroeconomics factors) remains predominant and cannot be diversify away. For example, the European dept crisis is a good example of a systematic risk that affects the stock market while the lack of innovation by Research in Motion would be a good example for an unsystematic risk that an investor could face. Therefore the goal of diversification is to minimize the risks for which an investor is not expecting to be rewarded.
It is a widespread belief that correlation tends to increase among different asset classes (stocks, commodities etc.) during turbulent market conditions and that implies a reduction in the benefits arising from portfolio diversification. This is exactly the time when an investor depends on these benefits the most, to keep his portfolio stable.
Diversification can be considered at a number of levels. While diversification among different asset classes has attracted a lot of research, the focus of this article is on diversification within equities or to be more precise, within the entire stocks among the Dow Jones Industrial Average (NYSEARCA:DIA).
We investigate, if the correlations among stocks within the Dow Jones Industrial Average are increasing during the time they are facing turbulences.
The mathematical background for diversification is well known. When investors diversify among stocks that are not perfectly correlated (having a correlation coefficient “ρ” less than +1) the volatility of the portfolio will be less than the weighted sum of the volatilities of the individual securities. All other things being equal, the lower the correlation between the different stocks the greater the diversification benefits will be.
Table 1 contains following data:
Table 1: The Degree of Correlation Coefficient Between Each Stock and an Equally Weighted Index.
Not surprisingly, stocks that show a high degree of correlation between them and the Dow Jones Industrial Average are also highly correlated to an equally weighted index, where all stocks within the Dow Jones Industrial Average are given the same weights. More importantly, their correlation coefficient tends to be higher in times other stocks within the DJIA are face a peak to valley event.
If we have a closer look at those five stocks that have the highest correlation coefficient, we can see that on average those stocks go down in more than 50 percent of the time, if any of all the other stocks within the Dow decreases. So in total, those stocks will decrease the benefits of diversification, especially in times of market turbulences.
The case is different, if we focus only on the top 5 stocks, in terms of a low correlation coefficient (green area). On average, those stocks tend to have an extremely low correlation coefficient in times other stocks are facing difficulties. In total, they fell in almost less than 45 percent of the time if any of all the other stocks within the DJI had decreased. So those stocks are increasing the benefits of diversification and therefore they minimize the risk within a portfolio significantly.
To prove those numbers, we have constructed two different portfolios:
Table 2 presents the results of our back tests from 2001/06/15 until 2012/06/01 on the two portfolios described previously. The first and second column tests the proposed Top 5- and Bottom 5 Stocks portfolio. The third column represents a buy and hold strategy on the Dow Jones Industrial Average.
Table 2: Performance Ratios of the 2 Portfolios
The allocation of the portfolio for January and February can be seen in the table below:
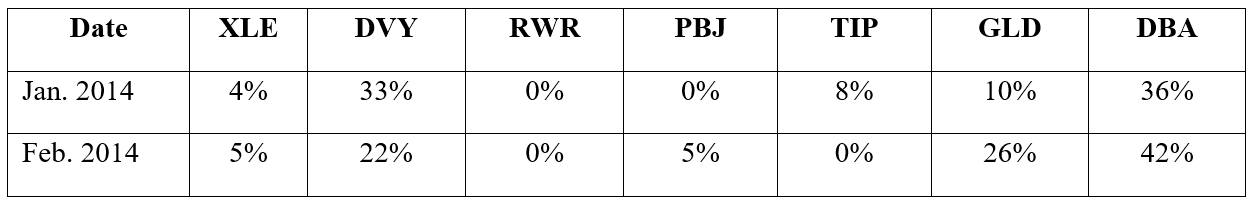
Table 2: Allocation of the Portfolio for January and February
The Top 5 Portfolio has an annualized return of 5.5% while a buy and hold has only generated an annualized rate of return of 1.2%. More importantly, on a risk-adjusted basis (Sharpe Ratio), the Top 5 Portfolio is strongly outperforming the buy and hold.
Chart 1: Historical Performance
If we have a closer look on the diversification benefits (reducing risk during turbulent market conditions), we can see that those stocks that have the lowest average draw down correlation, have also shown significant lower draw-downs in the past. The maximum draw down for the Top 5 Portfolio was only 37.9 percent compared to 70.1 percent for the Bottom 5 Portfolio. In total, the Top 5 Portfolio was reaching a new high after 716 days compared to 1115 days for the Bottom 5 Portfolio. The Dow Jones Industrial Average is still trading below its high from 2007.
Table 3: Largest Drawdowns Top 5 Stocks
Table 4: Largest Drawdowns Bottom 5 Stocks (with Highest Drawdown Correlation)
Table 5: Largest Drawdowns Dow Jones Industrial Average
Diversification does not eliminate systematic risk. No investment strategy does. However, a well diversified stock portfolio reduces the risk within a portfolio significantly. Even in times the market faces turbulent conditions, diversification helps to reduce draw-downs considerably. In our study we have found no proof that stocks have a higher correlation coefficient to other stocks in times they facing draw downs. In general, diversification is not just about investing money in different kind of stocks; it’s about the idea of investing in low-correlated securities, able to utilize the full benefits from this well proven strategy. The basic principle is working as long as investors do understand what diversification is all about.
Author: Robert C. Koch
Note: This research publication was published on Seeking Alpha in July 2012.
Start your journey towards informed and strategic investment decisions. With WallStreetCourier, you have the tools and insights to navigate market trends confidently. Join us today and transform your approach to trend following.
You are currently viewing a placeholder content from X. To access the actual content, click the button below. Please note that doing so will share data with third-party providers.
More Information