In recent years, new portfolio construction techniques focused on risk and diversification rather than expected average returns have become quite popular. This success has been due to an increasing acknowledgment that a traditional balanced portfolio, where 60 percent is allocated in equities and the remaining 40 percent is invested in bonds, is not diversified at all.
Our research paper, published and awarded as Editor’s Pick on Seeking Alpha, reviews a portfolio construction technique called “Maximum Diversification,” which maximizes the asset class diversification within a portfolio. The article refers to the WSC All Weather Portfolio, which is regularly updated in our members area.
It may look balanced from a capital allocation point of view, but it is not from a risk perspective, as equities are the main risk contributor within such a portfolio. After we have already written about the risk parity approach in our last article, we would like to review a portfolio construction technique, called “Maximum Diversification,” which has shown incredible results so far and which is being updated on a regular basis on our website.
The basic idea behind the maximum diversification approach is to construct a portfolio that maximizes the benefits from diversification. First of all, diversification can be measured by the so-called diversification ratio. This ratio is the portfolio’s weighted average asset volatility to its actual volatility. The result of this calculation measures the essence of diversification. Since different asset classes are not perfectly correlated to each other, this ratio in general > 1. In other words, a well-diversified portfolio is greater than the sum of its investments, as the overall risk of such a portfolio is less than the weighted-average risk of its component holdings. Therefore, every investor can measure the degree of diversification within its portfolio quite easily, with the following metric:
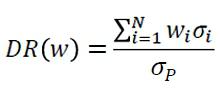
(wi = portfolio weight in asset i, σi = the risk of asset i, σp is the total risk of the portfolio)
Moreover, for a given set of underlying assets, there is only one portfolio combination that has the highest diversification ratio and thus represents the most diversified portfolio. In other words, it is possible to put the maximum weight into each asset class whereas the overall portfolio volatility is not being increased at all.
In our article, we would like to review a maximum diversification portfolio with the following investment universe:
In our example, there is no allowance for transaction costs or brokerage fees. In order to minimize transaction costs, we rebalance the portfolio on a monthly basis, whereas 1-day slippage is included. By applying the maximum diversification approach, it is absolute necessary to determine the weightings of each asset class on a regular basis, since the correlation among asset classes is not stable over time. We have used a rolling variance/co-variance matrix to determine the optimal diversification weights.
If we have a look at the diversification benefits this portfolio has utilized in the past (Chart 1), we can see that the diversification ratio reached a maximum score of 6, meaning that the overall portfolio risk was reduced by 500 percent. In this specific time period, the correlation among the underlying asset classes was extremely low. On average, the overall risk (Chart 1) within the portfolio was reduced by a factor of 2.7, while the minimum diversification factor had been 1.5 in September 2006. Apart from 2008, where the financial crisis hit the markets, the portfolio volatility itself swung between 2 and 9 percent, whereas the average volatility is around 5.5 percent. Since it is possible to put the most weight to each underlying asset class without increasing the total portfolio volatility, the expected returns of each security and thus the expected return of the portfolio remains unchanged.
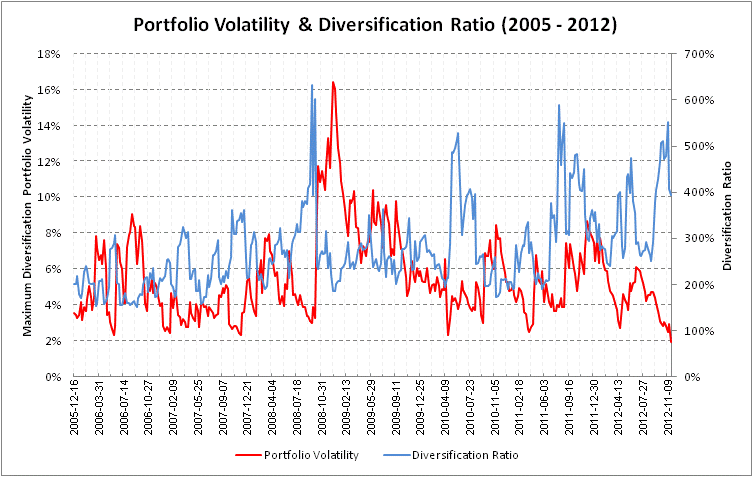
Chart 1: Portfolio Volatility & Diversification Ration 2005 – 2012
Another interesting fact is that the weighting of each asset class (Chart 2) is mainly driven by its diversification characteristic. In other words, if the correlation coefficient of an underlying security increases, the less weighting it will receive, since its diversification benefits are decreasing (according to the diversification factor). Therefore it can be possible, that certain high correlated securities will have no weight at all, or the other way round. As a result of this, it can be theoretically possible, that equities have a higher weighting than bonds, in times when the correlation coefficient of stocks to the overall portfolio tends to be lower than bonds. That is one of the main advantages versus the risk parity approach, where every asset class has the same contribution risk, whatever the correlation of those looks like! Another main advantage of this “All Weather Portfolio” over a risk parity strategy is the fact that it does not need leverage to achieve an attractive return profile.
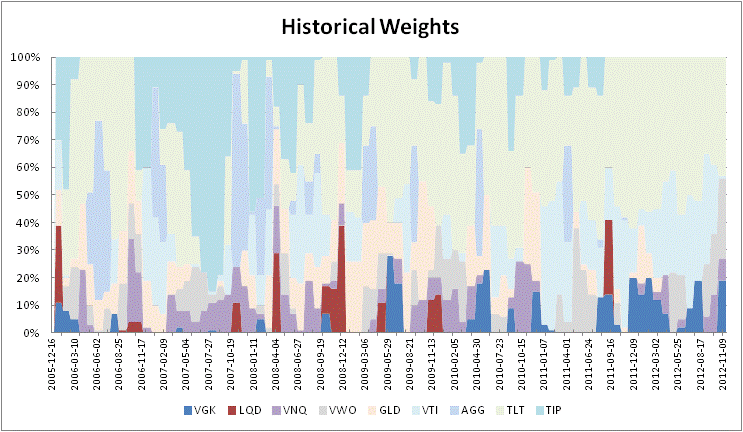
Chart 2: Weighting of each asset class
Since we have only focused on risk and portfolio weightings so far, we would like to examine how this portfolio has performed so far versus the S&P 500 (IVV). Table 1 is showing the results from December. 16, 2005 until Nov. 11, 2012 (including one day slippage). The first column tests the maximum diversification approach while the second on represents the S&P 500.
The maximum diversification approach has an annualized return of 10.6% while the S&P 500 (IVV) has only generated an annualized rate of return of 3.2%. More importantly, on a risk-adjusted basis (Sharpe Ratio), this “All Weather Portfolio” is strongly outperforming the broad benchmark. However, it was only slightly underperforming the S&P 500 (IVV), when equity markets have been in a strong bull market (2006).
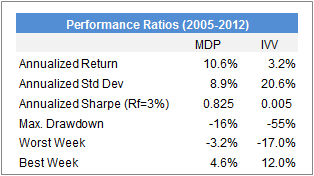
Table 1: Performance Ratios 2005 – 2012
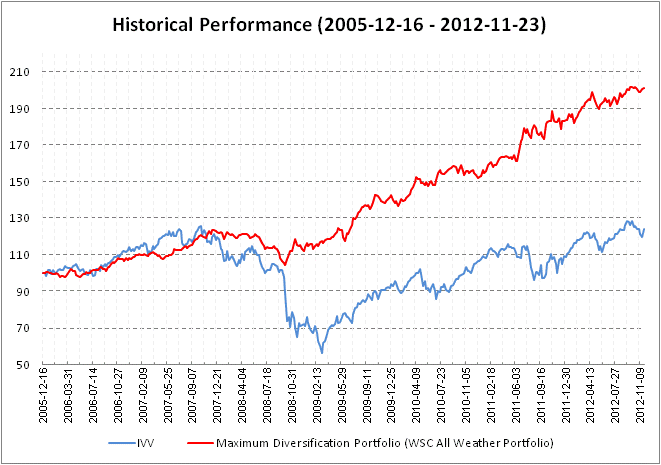
Historical Performance (2005-12-16 to 2012-11-23)
If we have a closer look on the diversification benefits (reducing risk during turbulent market conditions), we can see that this amazing portfolio construction approach has also shown significant lower draw-downs in the past. The maximum draw down for the so called “All Weather Portfolio” was only 15.6 percent, compared with 56.2 percent for the S&P 500 (IVV) [Chart 3 & Chart 4]. That makes roughly 3.5 times more. In total, the maximum diversification portfolio was reaching a new high after 76 weeks while the S&P 500 (IVV) is still struggling to reach its latest high in 2007.
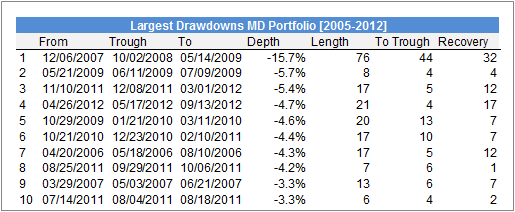
Chart 3: Largest Drawdowns MD Portfolio 2005-2012
![Largest Drawdowns IVV ETF [Weekly Basis 2005-2012]](https://www.wallstreetcourier.com/wp-content/uploads/2022/05/research_modern-portfolio-theory-2_7.png)
Chart 4: Largest Drawdowns IVV ETF [Weekly Basis 2005-2012]
The maximum diversification approach is a perfect tool if investors who are searching for a highly diversified portfolio, which tends to perform reasonably well in every market environment. Since it can fully utilize the benefits of diversification, so then the portfolio is able to reduce draw-downs considerably, especially in times of market turbulence.
Therefore, this asset allocation approach is perfectly suitable for investors who are searching for compound returns instead of a strategy that tries to capture every gain when equity markets are strong.
Nevertheless, the outcome of the strategy depends mainly on chosen asset classes, as this investment strategy allocates the most to those ETFs that have the lowest correlation coefficient. Therefore please bear in mind that any approach is only as good as the expected future value of its underlying asset classes as well as their future diversification characteristics.
Author: Robert C. Koch
Note: This research publication was published and awarded as Editor’s Pick on Seeking Alpha in November 2012.
Start your journey towards informed and strategic investment decisions. With WallStreetCourier, you have the tools and insights to navigate market trends confidently. Join us today and transform your approach to trend following.
You are currently viewing a placeholder content from X. To access the actual content, click the button below. Please note that doing so will share data with third-party providers.
More Information