Consumer Discretionary (XLY): Why This Sector Is Far Away from Being a Buy Right Now!

Market Regime Newsletter

A quick glimpse into our market research

Sample Research

Here’s a sample of our Market Regime Newsletter, where we analyze specific markets using our precise approach. This showcases our consistent research and enables users to efficiently apply our indicators and tools to any market.

Key Points:

This Market Regime Newsletter was issued on June 2nd, 2024

  • Consumer discretionary stocks are highly sensitive to economic cycles, with spending typically reduced during times of uncertainty, directly impacting sector companies.
  • Despite economic uncertainties in the previous year, the Consumer Discretionary ETF (XLY) delivered a stellar 2023 performance. However, this year, it struggled to maintain momentum, underperforming the broader market more significantly.
  • Nevertheless, this sector has recently caught the attention of hedge funds, which have turned bullish on consumer stocks according to Goldman Sachs
  • Despite the increasing popularity of Consumer Discretionary among hedge funds, our data lacks supporting evidence for any potential bullish case for that sector.
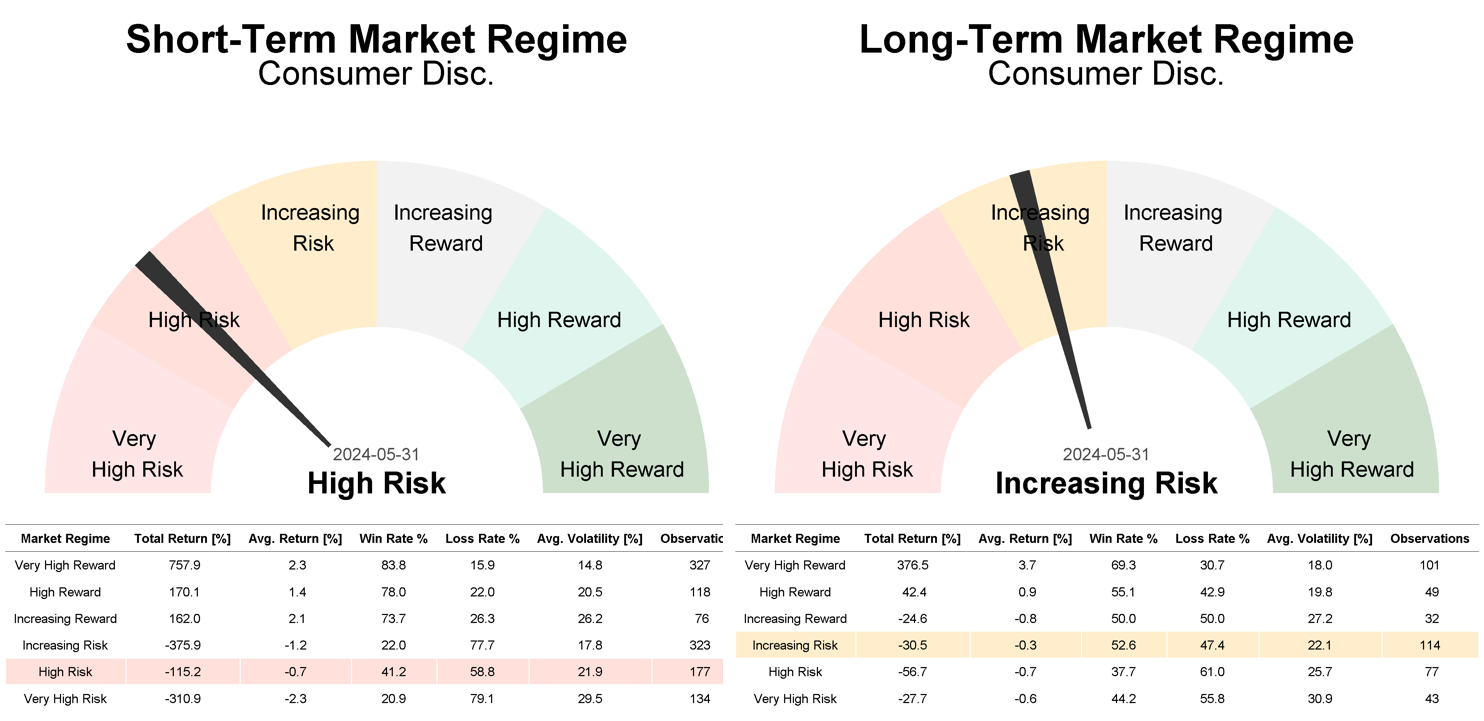
  • The Short-Term “Very High Risk” and Long-Term “Increasing Risk” Market Regime for the Consumer Discretionary ETF (XLY) continues to signal limited upside potential together with an increasing risk for negative surprises on the downside.

Current Market Regime of the Consumer Discretionary (XLY):

Description of the current Short- and Long-Term Market Regime:

Short-Term: Increasing Risk Market Regime:

Robust downtrend. This market regime represents a highly negative environment accompanied by significantly high volatility. Prices are generally decreasing, and this downward trend is supported by a broad range of underperforming stocks within that market. As a result, the market strongly reacts in a negative manner to any negative news. Positive trading days experienced are typically short-lived oversold reactions and, therefore, not sustainable in price and time.

Long-Term: Very High Reward Market Regime:

Consolidation: Negative market regime, accompanied by low but steady increasing volatility. The market is taking a breather after a period of stronger gains, as sentiment typically reaches extremely positive levels. Thus, nobody is left to push prices higher. In a shorter-term perspective, the trend turns negative, which is supported by a wide range of negatively performing stocks within that market.

Driving Forces Behind the Current Market Regime:

Our definition of market regimes is rooted in an extensive analysis and combination of multiple indicators, with the purpose of uncovering latent trends within major market indices and sectors. Signals from various indicators across categories such as trend, trend quality, and sentiment (including assessments of both dumb- and smart-money positioning) are systematically screened across different timeframes. This enables the classification of trends based on their direction and strength into six predefined market regimes. Each market regime is characterized by its own unique risk-reward profile, enabling an unbiased and robust view of current market conditions.

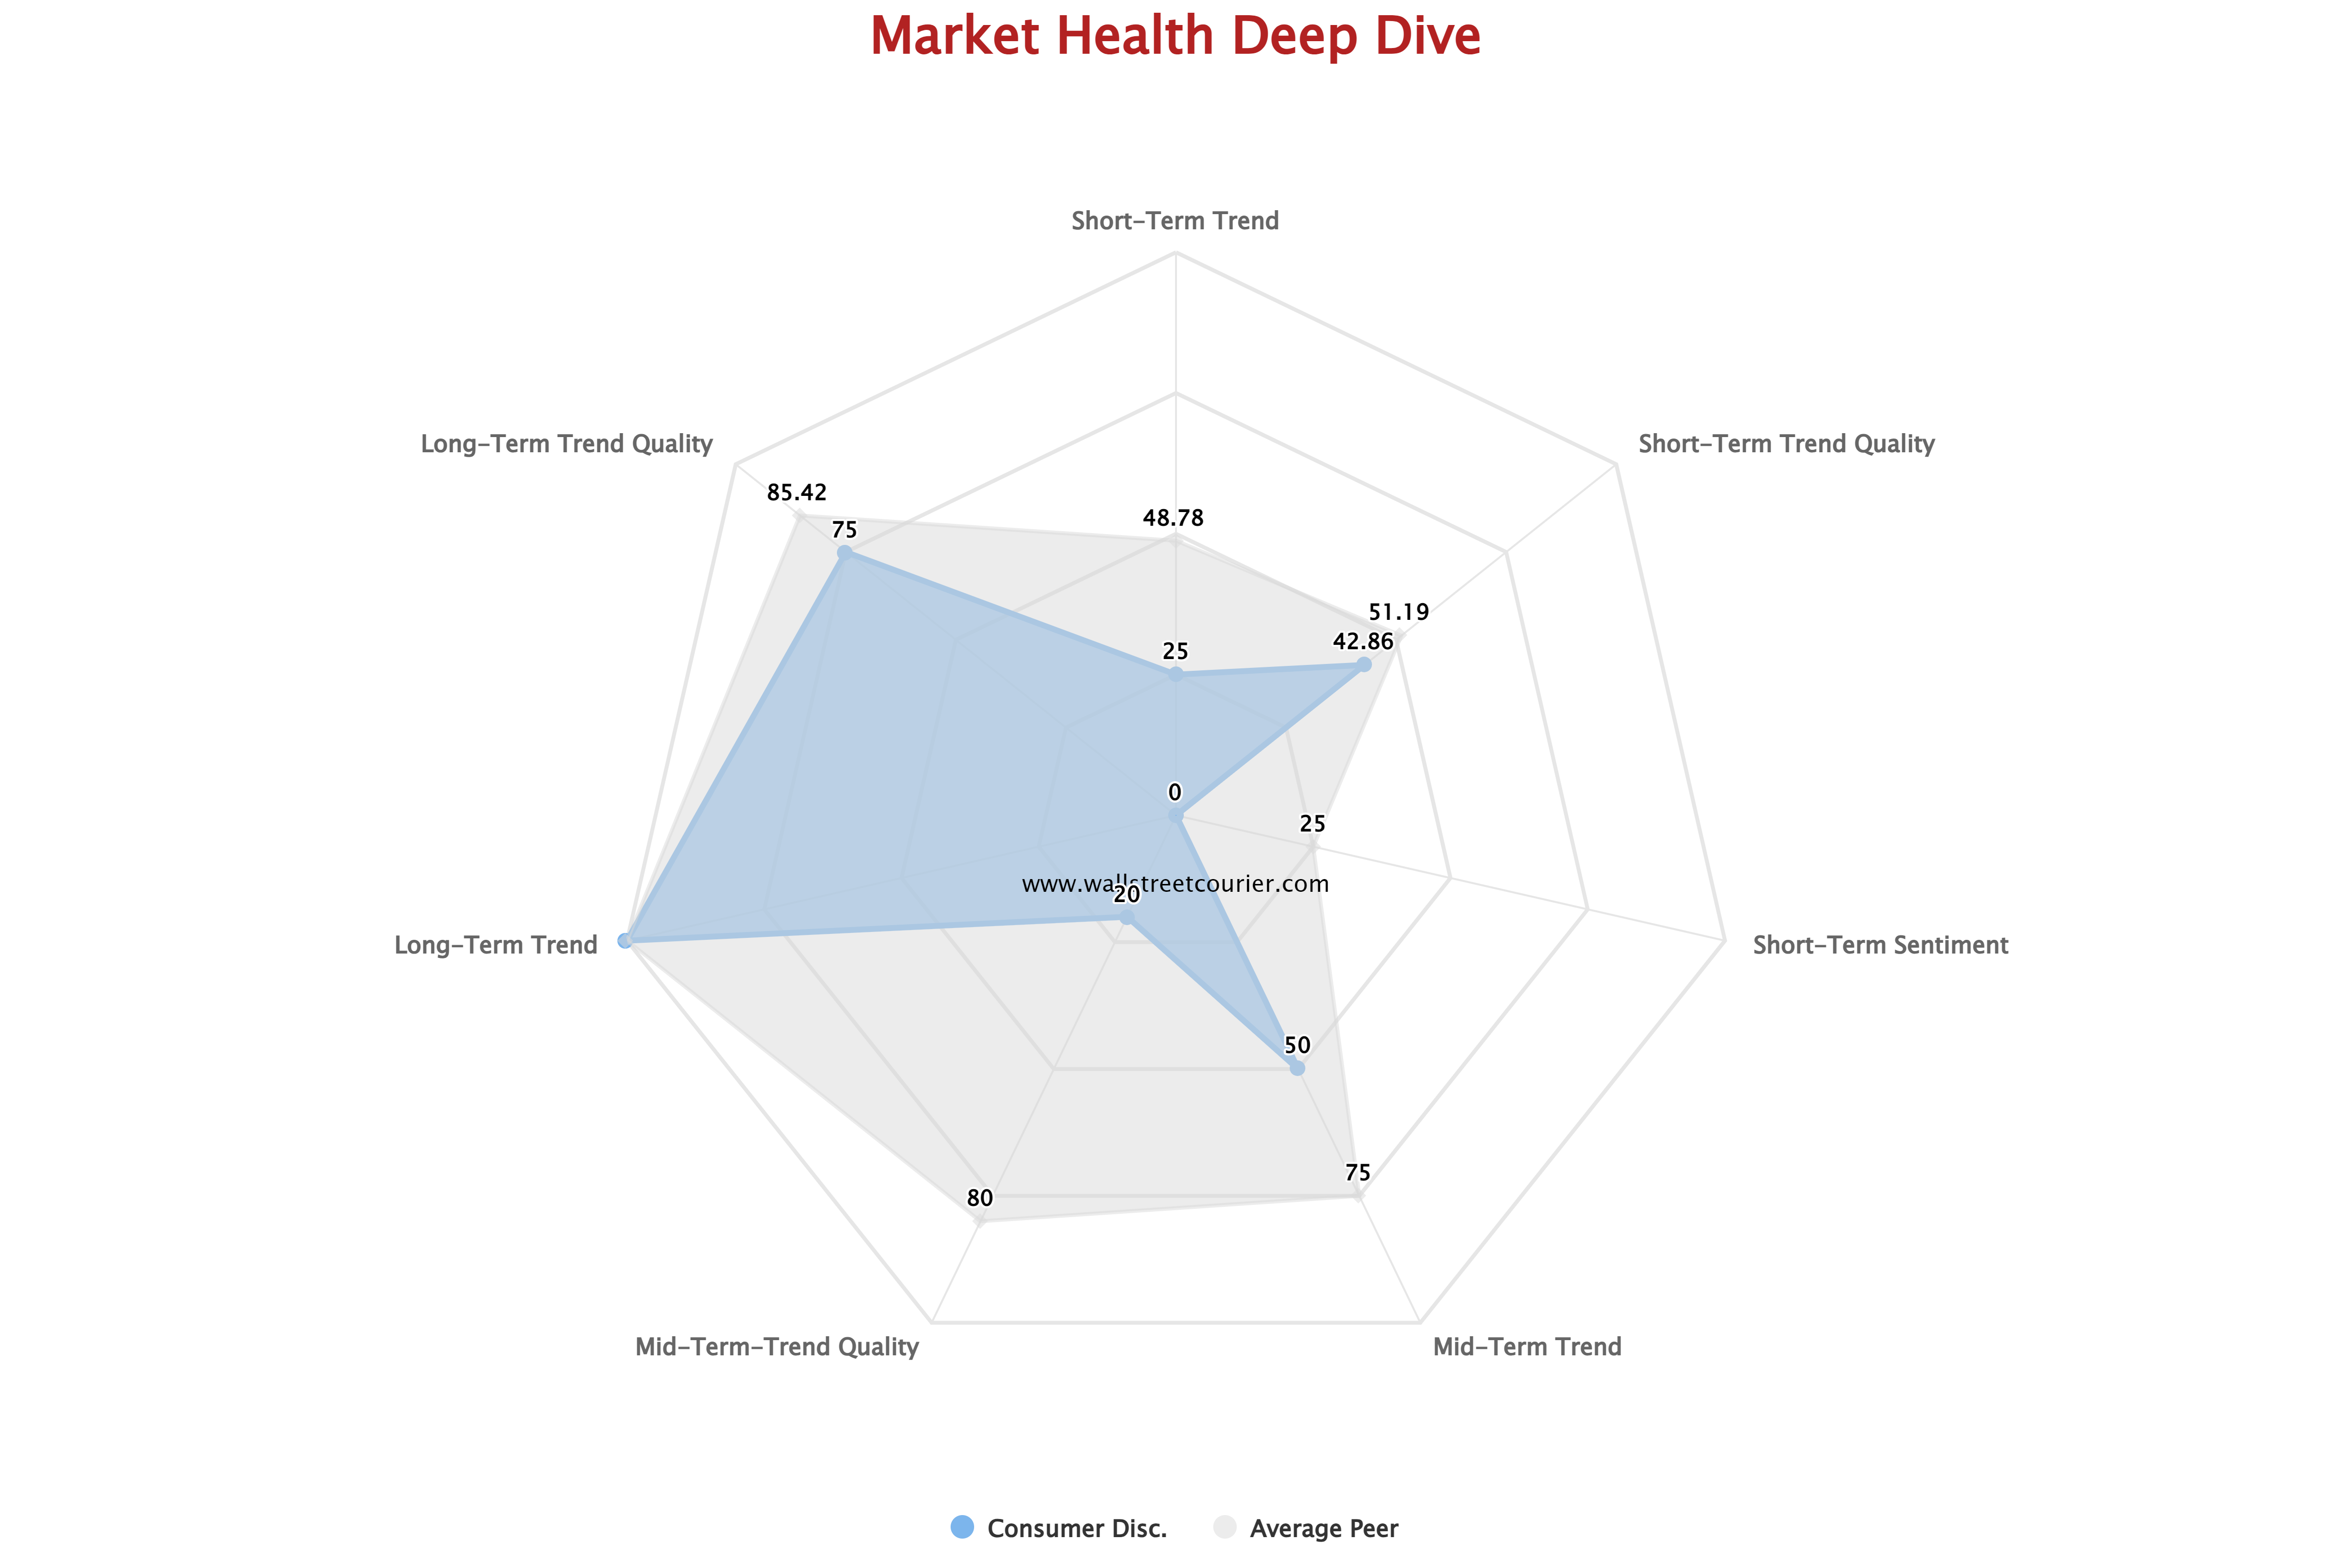
Further insight is provided by the spider chart below, displaying the current strength of each component (trend, trend quality, and sentiment). Here, we can observe that the current trend, trend quality, and sentiment in industrial stocks (XLY) not only have weakened significantly on a short-term basis, but also started to deteriorate on a mid- to long-term perspective. Such patterns typically align with the early stages of a robust downtrend, rather than signaling the sector’s preparation for a notable breakout to the upside.

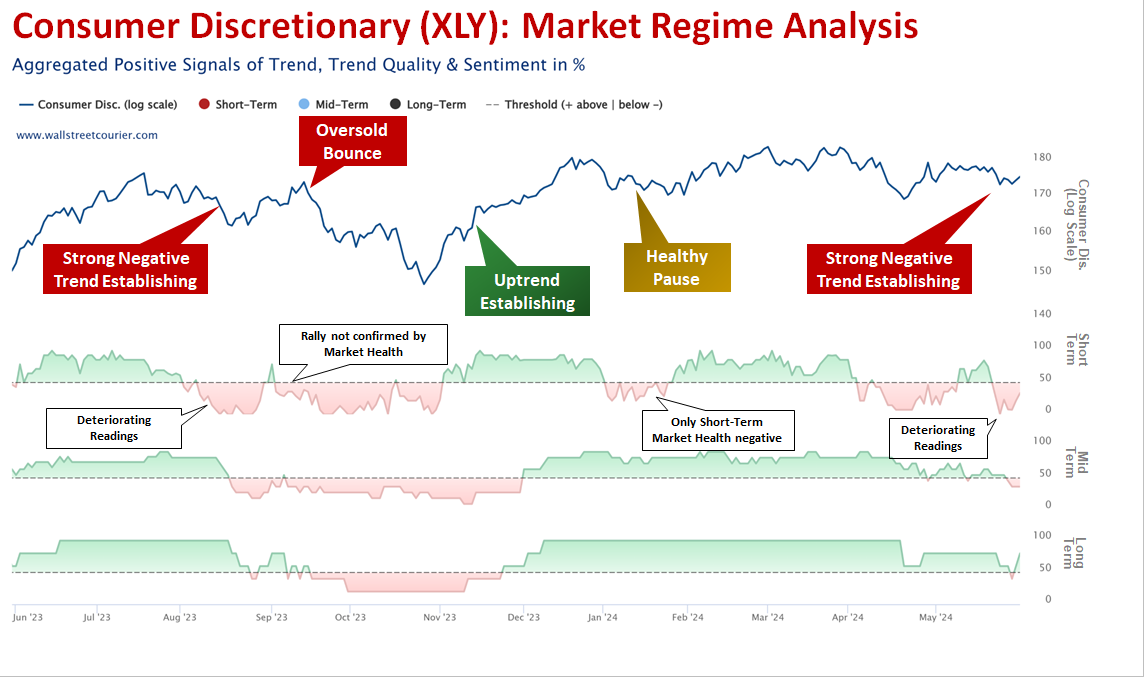
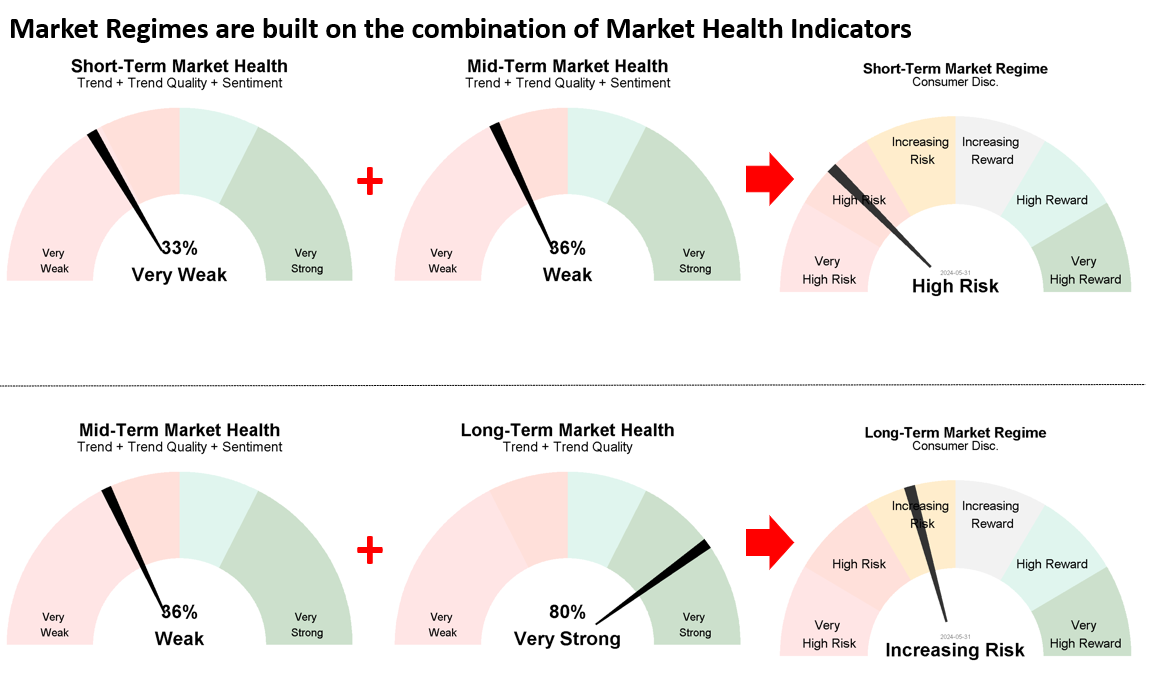
To monitor these performance factors over time, these signals are then combined into Market Health Indicators (as seen in the chart below). These indicators are representing composites of these signals for three different timeframes. Scores on a 0 to 100% scale denote signal positivity. Values below 50% indicate a negative outlook, while those above 50% signal positive market health. The combination of these health indicators results in market regimes, indicating the strength of the current trend for a specific timeframe.

The chart below illustrates the Consumer Discretionary Select Sector SPDR ETF (XLY) in the first panel, followed by three subsequent panels detailing Short-, Mid-, and Long-Term Market Health over time.

While it may be tempting to bet on discretionary stocks catching up with the broad market, there’s currently little reason to do so. Given the strongly negative Short-Term Market Health Indicator and weak readings in Mid- to Long-Term Market Health, the chances for a significant rally from current levels are low. Even worse, the market has formed a negative divergence with the current Market Health readings, putting discretionary stocks at high risk of significant declines from their current levels. Consumer discretionary stocks faced a similar situation in September 2023. At that time, Short-Term Market Health turned negative, followed by negative readings in Mid- to Long-Term Market Health. After a short-lived rally attempt that was not confirmed by Market Health, discretionary stocks faced a stronger correction until late October.

How to spot high-reward & low risk market opportunities

3 Steps for Determining Market Regimes

With our structured approach, we can identify the respective market regime for any market. Our methodology include the following steps:

1

Identify Robust Trends

  • Trends are measured through a systematic screening of signals from multiple indicators (for example the WSC Trend Index, the Smart Money Flow Index or the Daily Put-/Call Ratio All CBOE Options)
  • These indicators cover various categories (trend, trend quality, and sentiment, including dumb- and smart-money positioning) and timeframes.
  • This diversified approach minimizes the impact of noise in individual indicators and enables an unbiased and robust view of current market conditions.
2

Monitor Market Health

  • These indicators are representing composites of these signals for three different timeframes.
  • Scores on a 0 to 100% scale denote signal positivity.
  • Values below 50% indicate a negative outlook, while those above 50% signal positive market health.
  • The combination of these health indicators results in market regimes, indicating the strength of the current trend for a specific timeframe.

3

Determine Market Regimes

  • By combining short- to mid-term and mid-term to long-term market health readings, the specific market regime is determined.
  • These Market Regime gauges help identify market regimes and shifts without the hassle of going through all indicator signals.
  • To be more precise, the Tactical Short-Term Market Regime is constructed upon the combination of short- to mid-term market health, while the Strategic Long-Term Market Regime is based on the amalgamation of mid- to long-term market health.

Thus, even if we see a stronger rally attempt by consumer stocks, the risk of further substantial declines remains elevated as long as Mid- to Long-Term Market Health shows limited signs of recovery. Even without immediate declines, the risk of significant underperformance against other global market indices remains high. Therefore, in our opinion, it is not advisable to jump on the hedge fund bandwagon—at least not at this juncture.

From Market Health Indicators To Market Regimes:

This negative market environment is reflected in our Market Regimes Gauges below. By combining signals from short- to mid-term and long-term indicators into Market Health readings, we determine the specific market regime. These Market Regime gauges help identify market regimes and shifts without the hassle of going through all indicator signals. To be more precise, the Tactical Short-Term Market Regime is constructed upon the combination of Short- to Mid-term Market Health, while the Strategic Long-Term Market Regime is based on the amalgamation of Mid- to Long-term Market Health.

What the history tells us about the current Market Regimes

Since full market regime data became available in 1999, the Consumer Discretionary ETF (XLY) has entered a ‘Very High Risk’ market regime 178 times from a short-term perspective and an ‘Increasing Risk’ market regime 114 times from a long-term perspective. In the short-term ‘Very High Risk’ regime, consumer discretionary stocks (XLY) declined in 58.8% of instances. From a long-term perspective, these stocks also demonstrate weakness. Historically, consumer discretionary stocks have yielded an average return of -0.3% when in a long-term ‘Increasing Risk’ market regime.

The Bottom Line

  • While hedge funds may be showing enthusiasm for consumer discretionary stocks, our analysis suggests caution.
  • Despite a strong performance in 2023, the sector has struggled to maintain momentum this year, underperforming the broader market.
  • Moreover, Market Health signals significant risks ahead. Historical data reveals that consumer discretionary stocks have faced challenges in similar market regimes, leading to negative returns.
  • Consequently, there are certainly more appealing markets available to enhance your portfolio’s performance this year.

Want our Market Regime Trend Analysis sent directly to your mailbox?

Market Regime Newsletter

In our Market Regime Newsletter, we provide analyses of specific markets using our approach to deliver precise outlooks. This showcases our consistent research approach and enables users to efficiently apply our indicators and tools to analyze any market.

Subscribe to our Market Regime Newsletter