This is the Logo of WallStreetCourier

Hang Seng Index (HSI): Has The Bear Market Come To An End?

Market Regime Newsletter

A quick glimpse into our market research

Sample Research

Here’s a sample of our Weekly Market Regime Newsletter, also serving as a blueprint for using our tools to identify profitable market regimes

Key Points:

This Market Regime Newsletter was issued on April 28th, 2024

  • The Hang Seng Index, representing Hong Kong’s largest and most liquid listed stocks, has experienced a significant decline of over 40 percent since its peak in February 2021.
  • Amidst the prolonged bear market, investor interest in the HSI has waned, resulting in diminished coverage by research analysts and financial news outlets.
  • Despite the market’s enduring bearish trend, our data suggests a potential turnaround, presenting a compelling opportunity for contrarian investors.
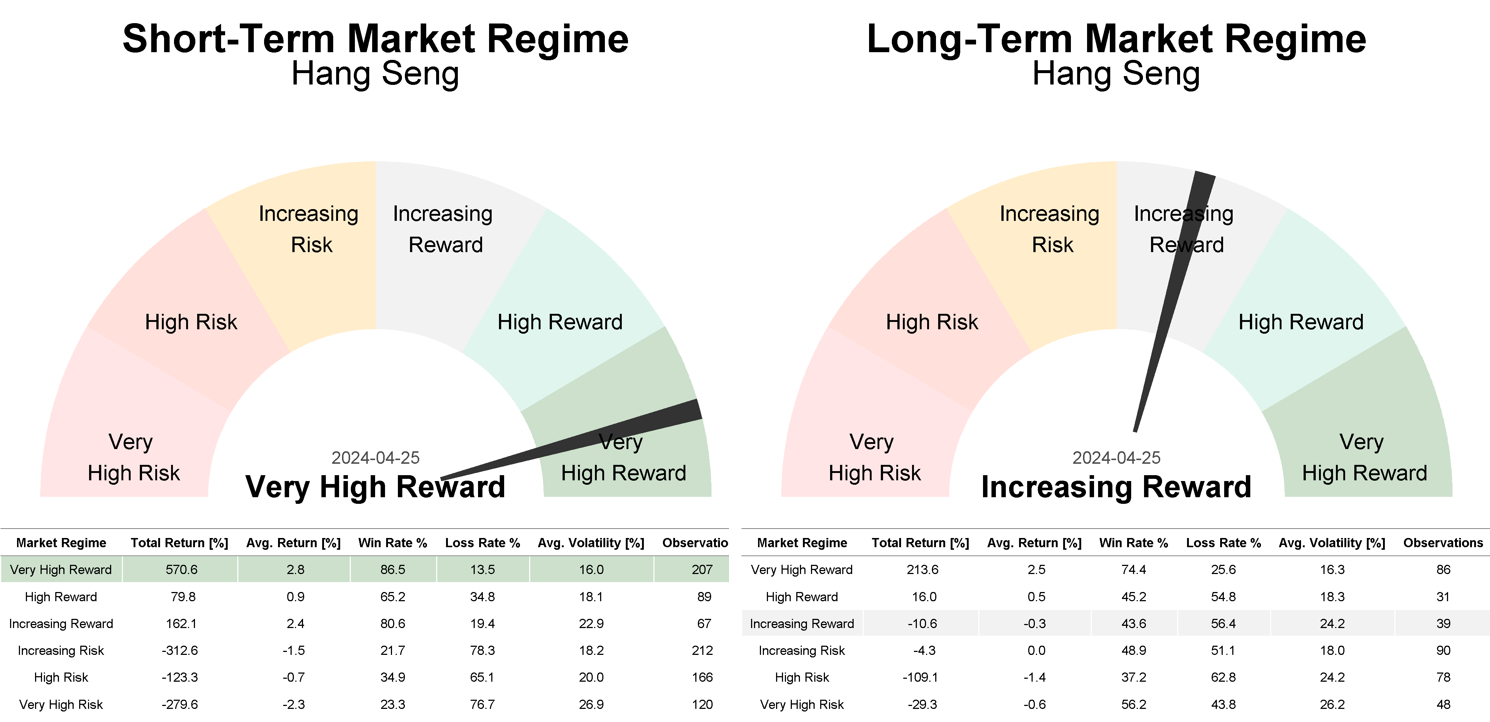
  • This fact can also be observed by examining the current market regime for the Hang Seng, which indicates a ‘Very High Reward’ market regime for the short-term perspective and an ‘Increasing Reward’ market regime for the long-term perspective.

Current Market Regime of the Hang Seng Index (HSI)

Description of the current Short- and Long-Term Market Regime:

Short-Term: Very High Reward:

Robust uptrend. Highly positive market regime accompanied by significantly low volatility. Prices consistently show an upward trend, supported by a wide range of well-performing stocks within that market. Even in the face of negative news, the market demonstrates remarkable resilience with such a high positive trend quality. Weak trading days are typically short-lived overbought or sentiment driven reactions, leaving the market better positioned for further gains.

Long-Term: Increasing Reward:

Establishing uptrend. Positive biased market regime, characterized by high volatility. Prices show stronger signs of stabilization after an extended period of extreme negative trading days. The negative trend weakens as the broad market is getting back on track. This transition is causing increased volatility. Sentiment is typically fearful, leaving the market better positioned to react strongly to positive news flow. Given the fact that the longer-term oriented trend picture is still quite damaged, the recovery remains at risk of fading at some point in time. Thus, differentiating whether these gains mark the beginning of a new sustainable uptrend or are just the result of an oversold bounce remains a challenge in that regime

Driving Forces Behind the Current Market Regime:

Our definition of market regimes is rooted in an systematic analysis and combination of multiple indicators, aimed to identifying robust trends. Trends are measured through an analyzis of signals from multiple indicators across various categories (trend, trend quality, and sentiment, including dumb- and smart-money positioning) and timeframes. This diversified approach enables an unbiased and robust view of current market conditions as it analyzes the most important trend factors.

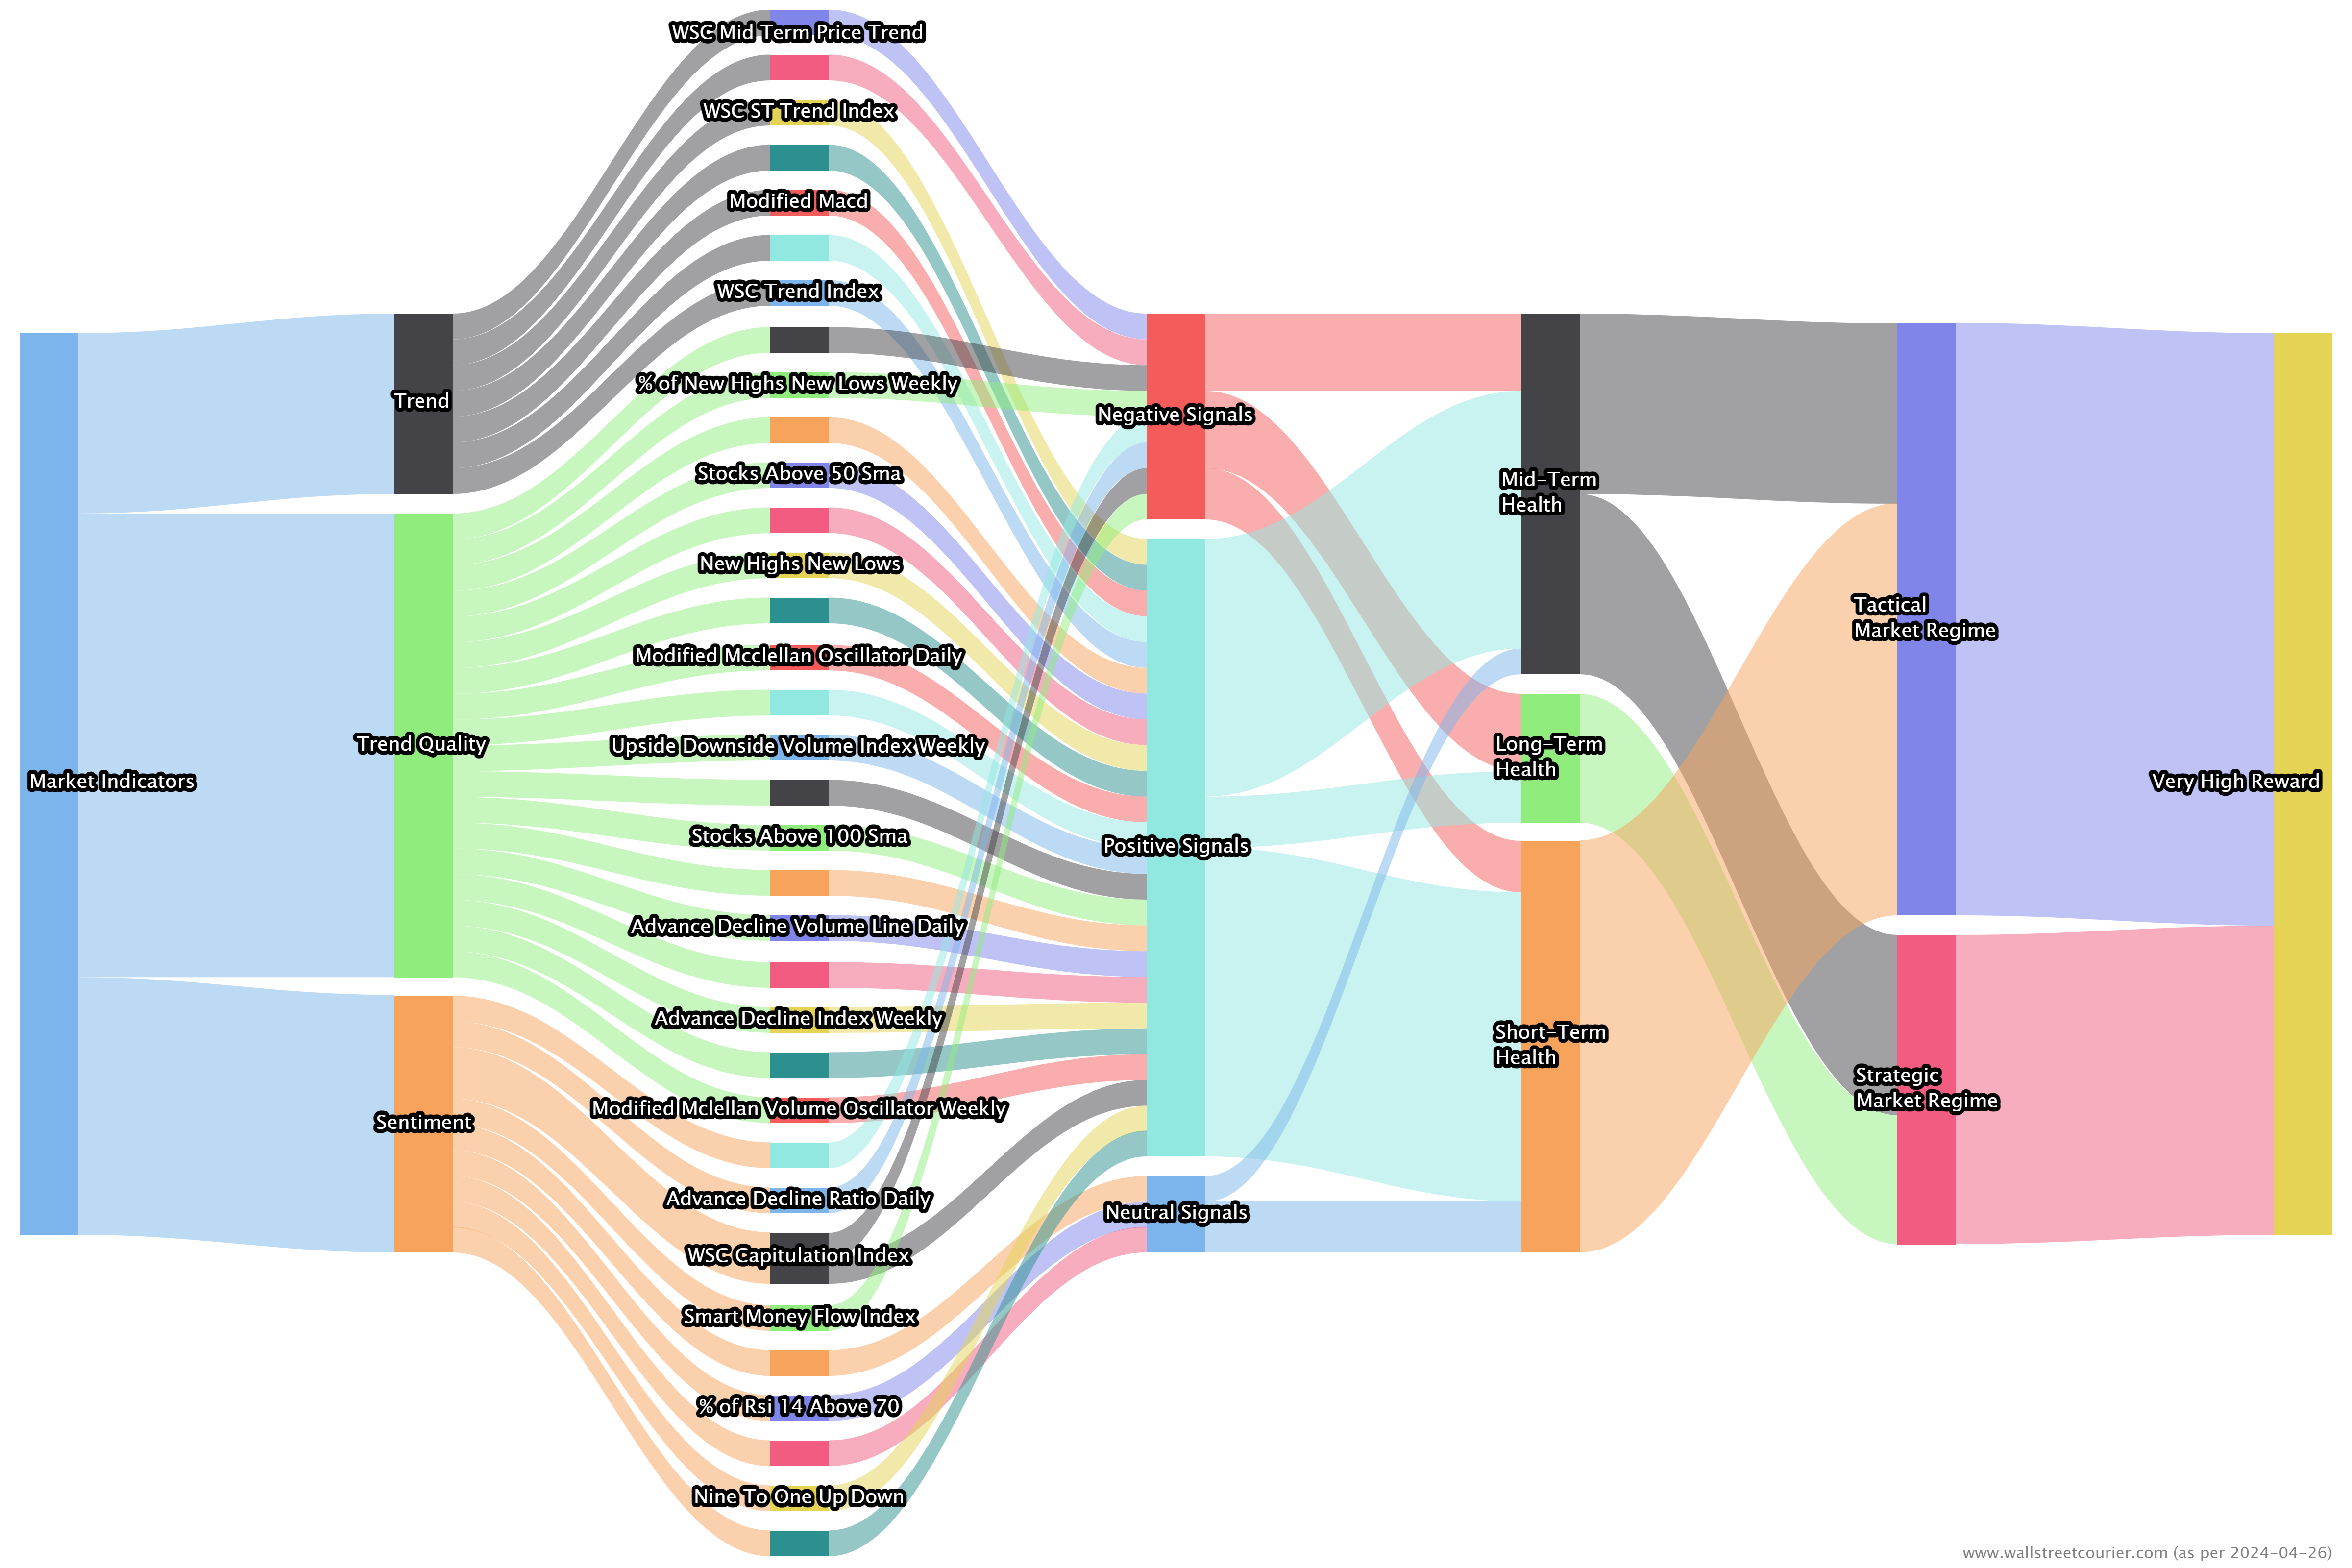
This is also illustrated in the flowchart below, providing a clear snapshot of the various trend components influencing the current market regime of the Hang Seng Index (HSI).

Across key metrics such as trend, trend quality, and sentiment, the market largely displays positive signals for the short- to mid-term perspective. These indicators include the MACD, RSI, Smart Money, and typical trend quality measures such as the percentage of stocks trading above their 20/50/100/150-day moving averages, upvolume, new highs versus new lows, and more. This shows a ‘Very High Reward’ market regime for the short term, as the uptrend is fueled by positive momentum and an expanding pool of stocks joining the rally. However, there are negative signals, primarily affecting the long-term condition, suggesting that the recent recovery rally is still quite fragile in nature, resulting in an Increasing Reward market regime.

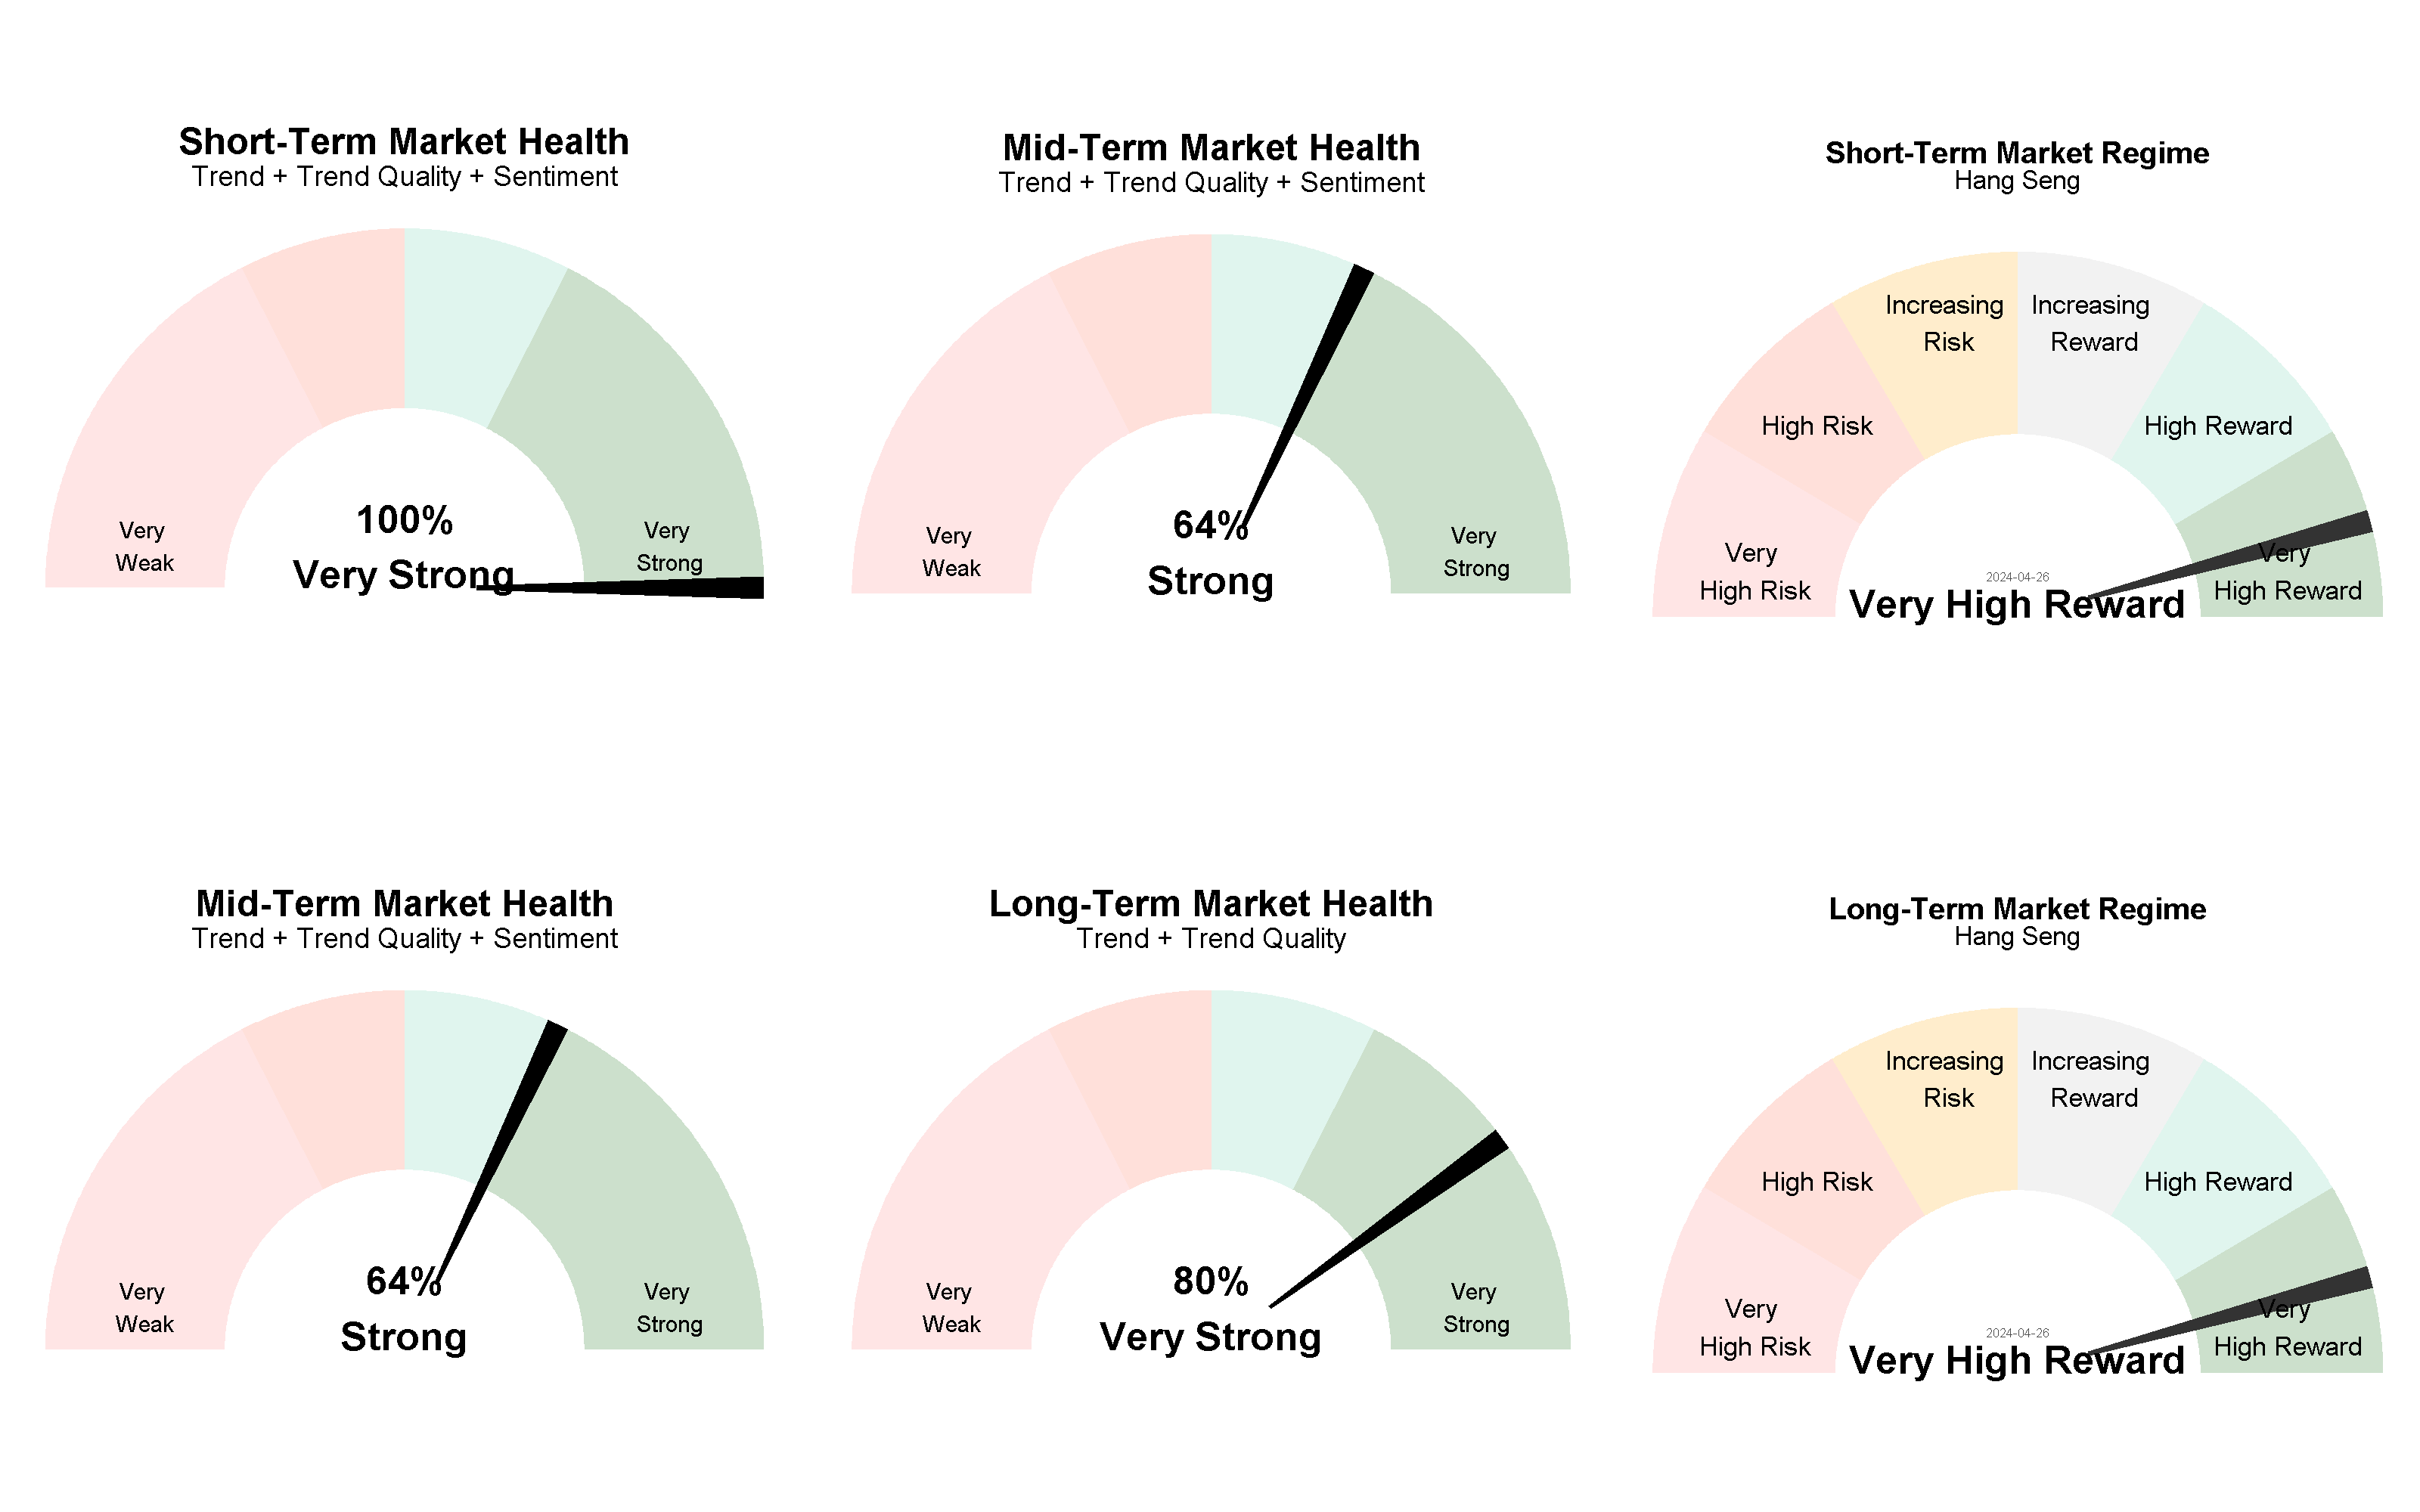
To monitor the trend status of Hang Seng Index (HSI) over time, we combine this key components according to their time frame into Market Health Indicators. These indicators are representing composites of these key componentes for three different timeframes. Scores on a 0 to 100% scale denote signal positivity. Values below 50% indicate a negative outlook, while those above 50% signal positive market health.

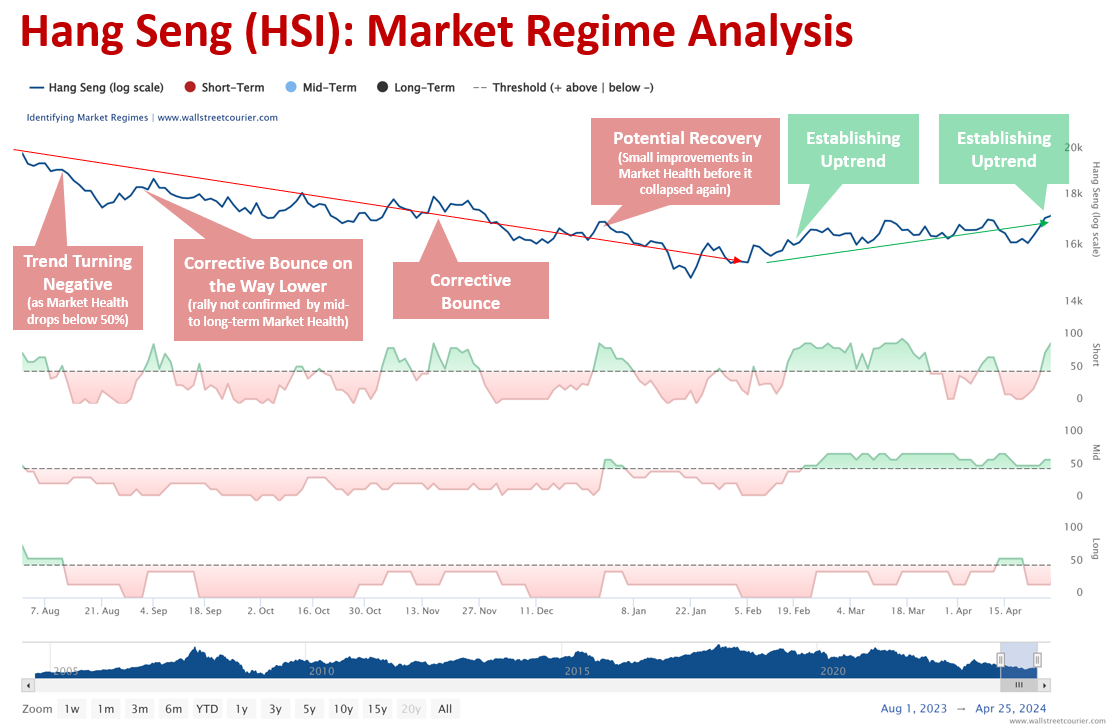
The chart below illustrates the Hang Seng Index (HSI) in the first panel, followed by three subsequent panels detailing Short-, Mid-, and Long-Term Market Health (from August 2023 until April 2024).

Throughout most of the period shown above, Short- to Long-Term Market Health readings were mainly below 50%, indicating strong negative signals in our trend, trend quality, and sentiment indicators. This pattern is characteristic of a pronounced downtrend resulting in a ‘Very High Risk’ market regime. Often, these steep downtrends are punctuated by robust oversold bounces, driven by short-sellers capitalizing on profits, typically prompted by positive newsflow. However, since these gains lack substantial backing from real demand, the market swiftly reverts to its initial downtrend once short-sellers resume their positions. These corrective bounces can be easily identified, as in such scenarios, only the ‘Short-Term Market Health’ metric shows signs of recovery, while the mid- to long-term market health remains weak or even well below 50%.

How to spot high-reward & low risk market opportunities

3 Steps for Determining Market Regimes

With our structured approach, we can identify the respective market regime for any market. Our methodology include the following steps:

1

Identify Robust Trends

  • Trends are measured through a systematic screening of signals from multiple indicators (for example the WSC Trend Index, the Smart Money Flow Index or the Daily Put-/Call Ratio All CBOE Options)
  • These indicators cover various categories (trend, trend quality, and sentiment, including dumb- and smart-money positioning) and timeframes.
  • This diversified approach minimizes the impact of noise in individual indicators and enables an unbiased and robust view of current market conditions.
2

Monitor Market Health

  • These indicators are representing composites of these signals for three different timeframes.
  • Scores on a 0 to 100% scale denote signal positivity.
  • Values below 50% indicate a negative outlook, while those above 50% signal positive market health.
  • The combination of these health indicators results in market regimes, indicating the strength of the current trend for a specific timeframe.

3

Determine Market Regimes

  • By combining short- to mid-term and mid-term to long-term market health readings, the specific market regime is determined.
  • These Market Regime gauges help identify market regimes and shifts without the hassle of going through all indicator signals.
  • To be more precise, the Tactical Short-Term Market Regime is constructed upon the combination of short- to mid-term market health, while the Strategic Long-Term Market Regime is based on the amalgamation of mid- to long-term market health.

Things play out differently when the rally is powered by widespread demand. In such instances, the initial counter-trend rally evolves into a more substantial uptrend. This has been evident recently as short-term market health increased to quite confirmative levels, while we even see persistent strength in mid-term market health. This shows that the current recovery rally in the Hang Seng Index is fueled by robust demand, indicating a good chance for that market to bottom out from its long-term bear market.

From Market Health Indicators To Market Regimes:

This positive market environment is reflected in our Market Regimes Gauges below. By combining short- to mid-term and mid-term to long-term market health readings, the specific market regime is determined. These market regime gauges help identify market regimes within seconds. To be more precise, the Tactical Short-Term Market Regime is constructed upon the combination of short- to mid-term market health, while the Strategic Long-Term Market Regime is based on the amalgamation of mid- to long-term market health.

What the history tells us about the current Market Regimes

Since the availability of full market regime data in 2004, the Hang Seng Index (HSI) has entered a ‘Very High Reward’ market regime 207 times in the short term and an ‘Increasing Reward’ market regime 39 times in the long term. Impressively, during ‘Very High Reward’ periods, the HSI yielded positive returns in 86.5% of instances. However, the picture changes slightly for the longer-term ‘Increasing Reward’ market regime, with a win rate of only 43.6% and an average return of -0.3%. This suggests that the ‘Increasing Reward’ regime often serves as a transitional phase from negative to positive, as indicated by its low observation rate and relatively flat average return.

The Bottom Line

  • In today’s market landscape, we’re seeing a familiar pattern emerge after a prolonged downturn. Short-term indicators are flashing green, suggesting a market on the rebound, and there’s optimism stretching into the longer term. But despite the positive vibes and enticing valuations, investors are holding back, still feeling the sting of the recent bearish run.
  • It’s a classic setup for a powerful counter-trend rally, possibly marking a turning point in the market. But let’s not get ahead of ourselves – with the longer-term trend still showing weakness, there’s a chance this rally could fizzle out. So, while the Hang Seng Index looks like a tempting opportunity for savvy investors, let’s keep an eye on our Market Health Readings for further confirmation.