The Big Nikkei Dip: Buying Opportunity or a Sign of a Significant Downturn Ahead?

Market Regime Newsletter

A quick glimpse into our market research

Sample Research

Here’s a sample of our Market Regime Newsletter, where we analyze specific markets using our precise approach. This showcases our consistent research and enables users to efficiently apply our indicators and tools to any market.

Key Points:

This Market Regime Newsletter was issued on March 17th, 2024

  • The Nikkei 225 has surged by a substantial 8.5% since we emphasized that the January dip was a promising entry point and by an impressive 15.8% since we highlighted the positive market regime in November last year.
  • Despite this stellar performance, the Nikkei 225 lost almost 4% since last week sparking major concerns among investors of a more significant downturn.
  • Despite this temporarily slowdown, we expect that momentum will pick up soon as the index is still supported by a wide range of stocks maintaining a strong uptrend. This view aligns with the current market regime combination, which typically occurs during a healthy pause within a sustained uptrend.
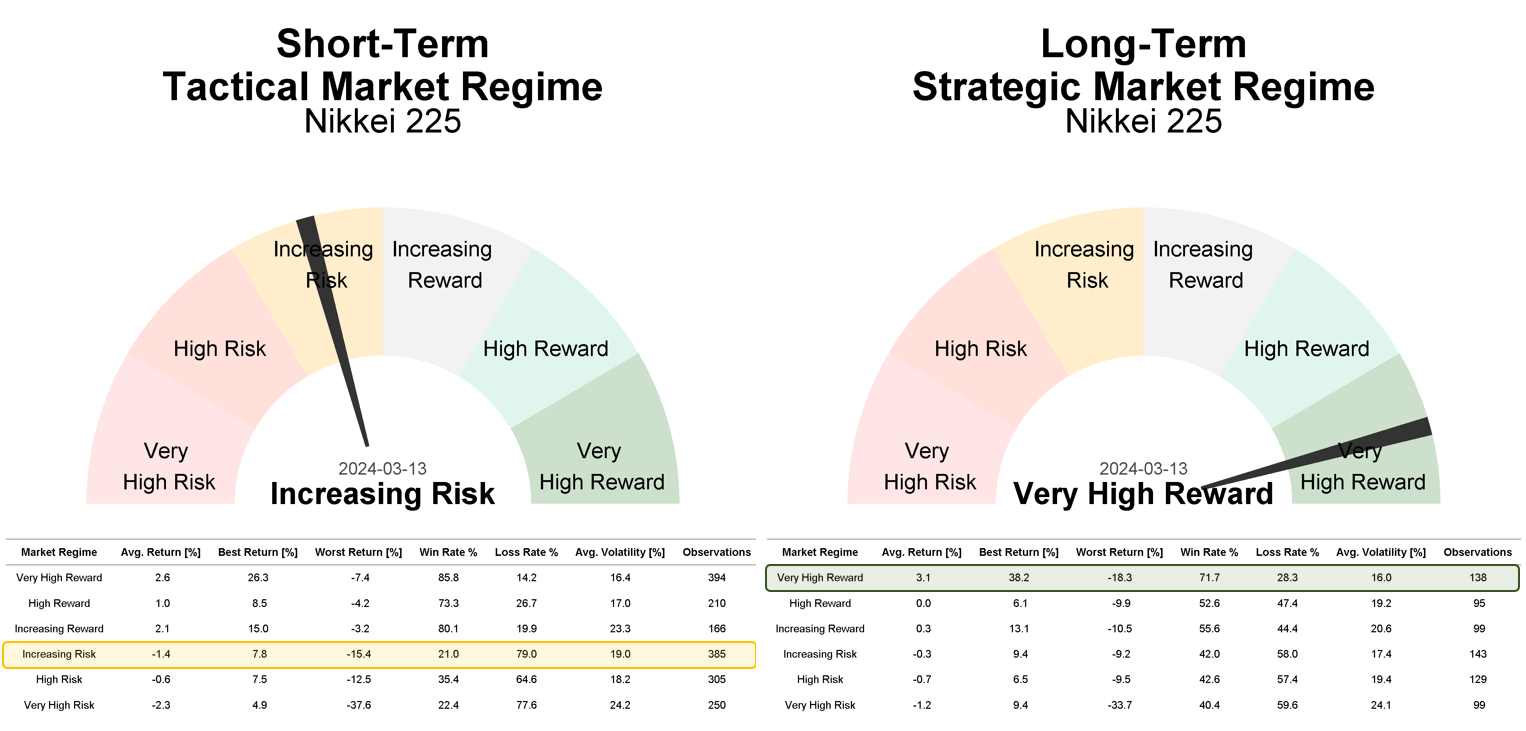
  • Historically, the Nikkei 225 saw gains in 71.1% of cases during long-term ‘Very High Reward’ market regimes. Conversely, during short-term consolidations within these uptrends (indicating a ‘Short-Term Increasing Risk’ market regime), it experienced an average loss of 1.4%.

Current Market Regime of the Nikkei 225

Description of the current Short- and Long-Term Market Regime

Short-Term Increasing Risk Market Regime:

Negative market regime, accompanied by low but steady increasing volatility. The market is taking a breather after a period of stronger gains, as sentiment typically reaches extremely positive levels. Thus, nobody is left to push prices higher. In a shorter-term perspective, the trend turns negative, which is supported by a wide range of negatively performing stocks within that market. Given the fact that the trend and the trend quality on a longer time perspective are still supportive, there is a chance that the market is getting back on track when sentiment turns fearful.

Long-Term Very High Reward Market Regime:

Highly positive market regime accompanied by significantly low volatility. Prices consistently show an upward trend, supported by a wide range of well-performing stocks within that market. Even in the face of negative news, the market demonstrates remarkable resilience with such a high positive trend quality. Weak trading days are typically short-lived overbought or sentiment driven reactions, leaving the market better positioned for further gains.


Driving Forces Behind the Current Market Regime:

Our definition of market regimes is rooted in an extensive analysis and combination of multiple indicators, aimed to identifying robust trends. To be more precise, trends are measured through a systematic screening of signals from multiple indicators across various categories (trend, trend quality, and sentiment, including dumb- and smart-money positioning) and timeframes. This diversified approach minimizes the impact of noise in individual indicators and enables an unbiased and robust view of current market conditions.
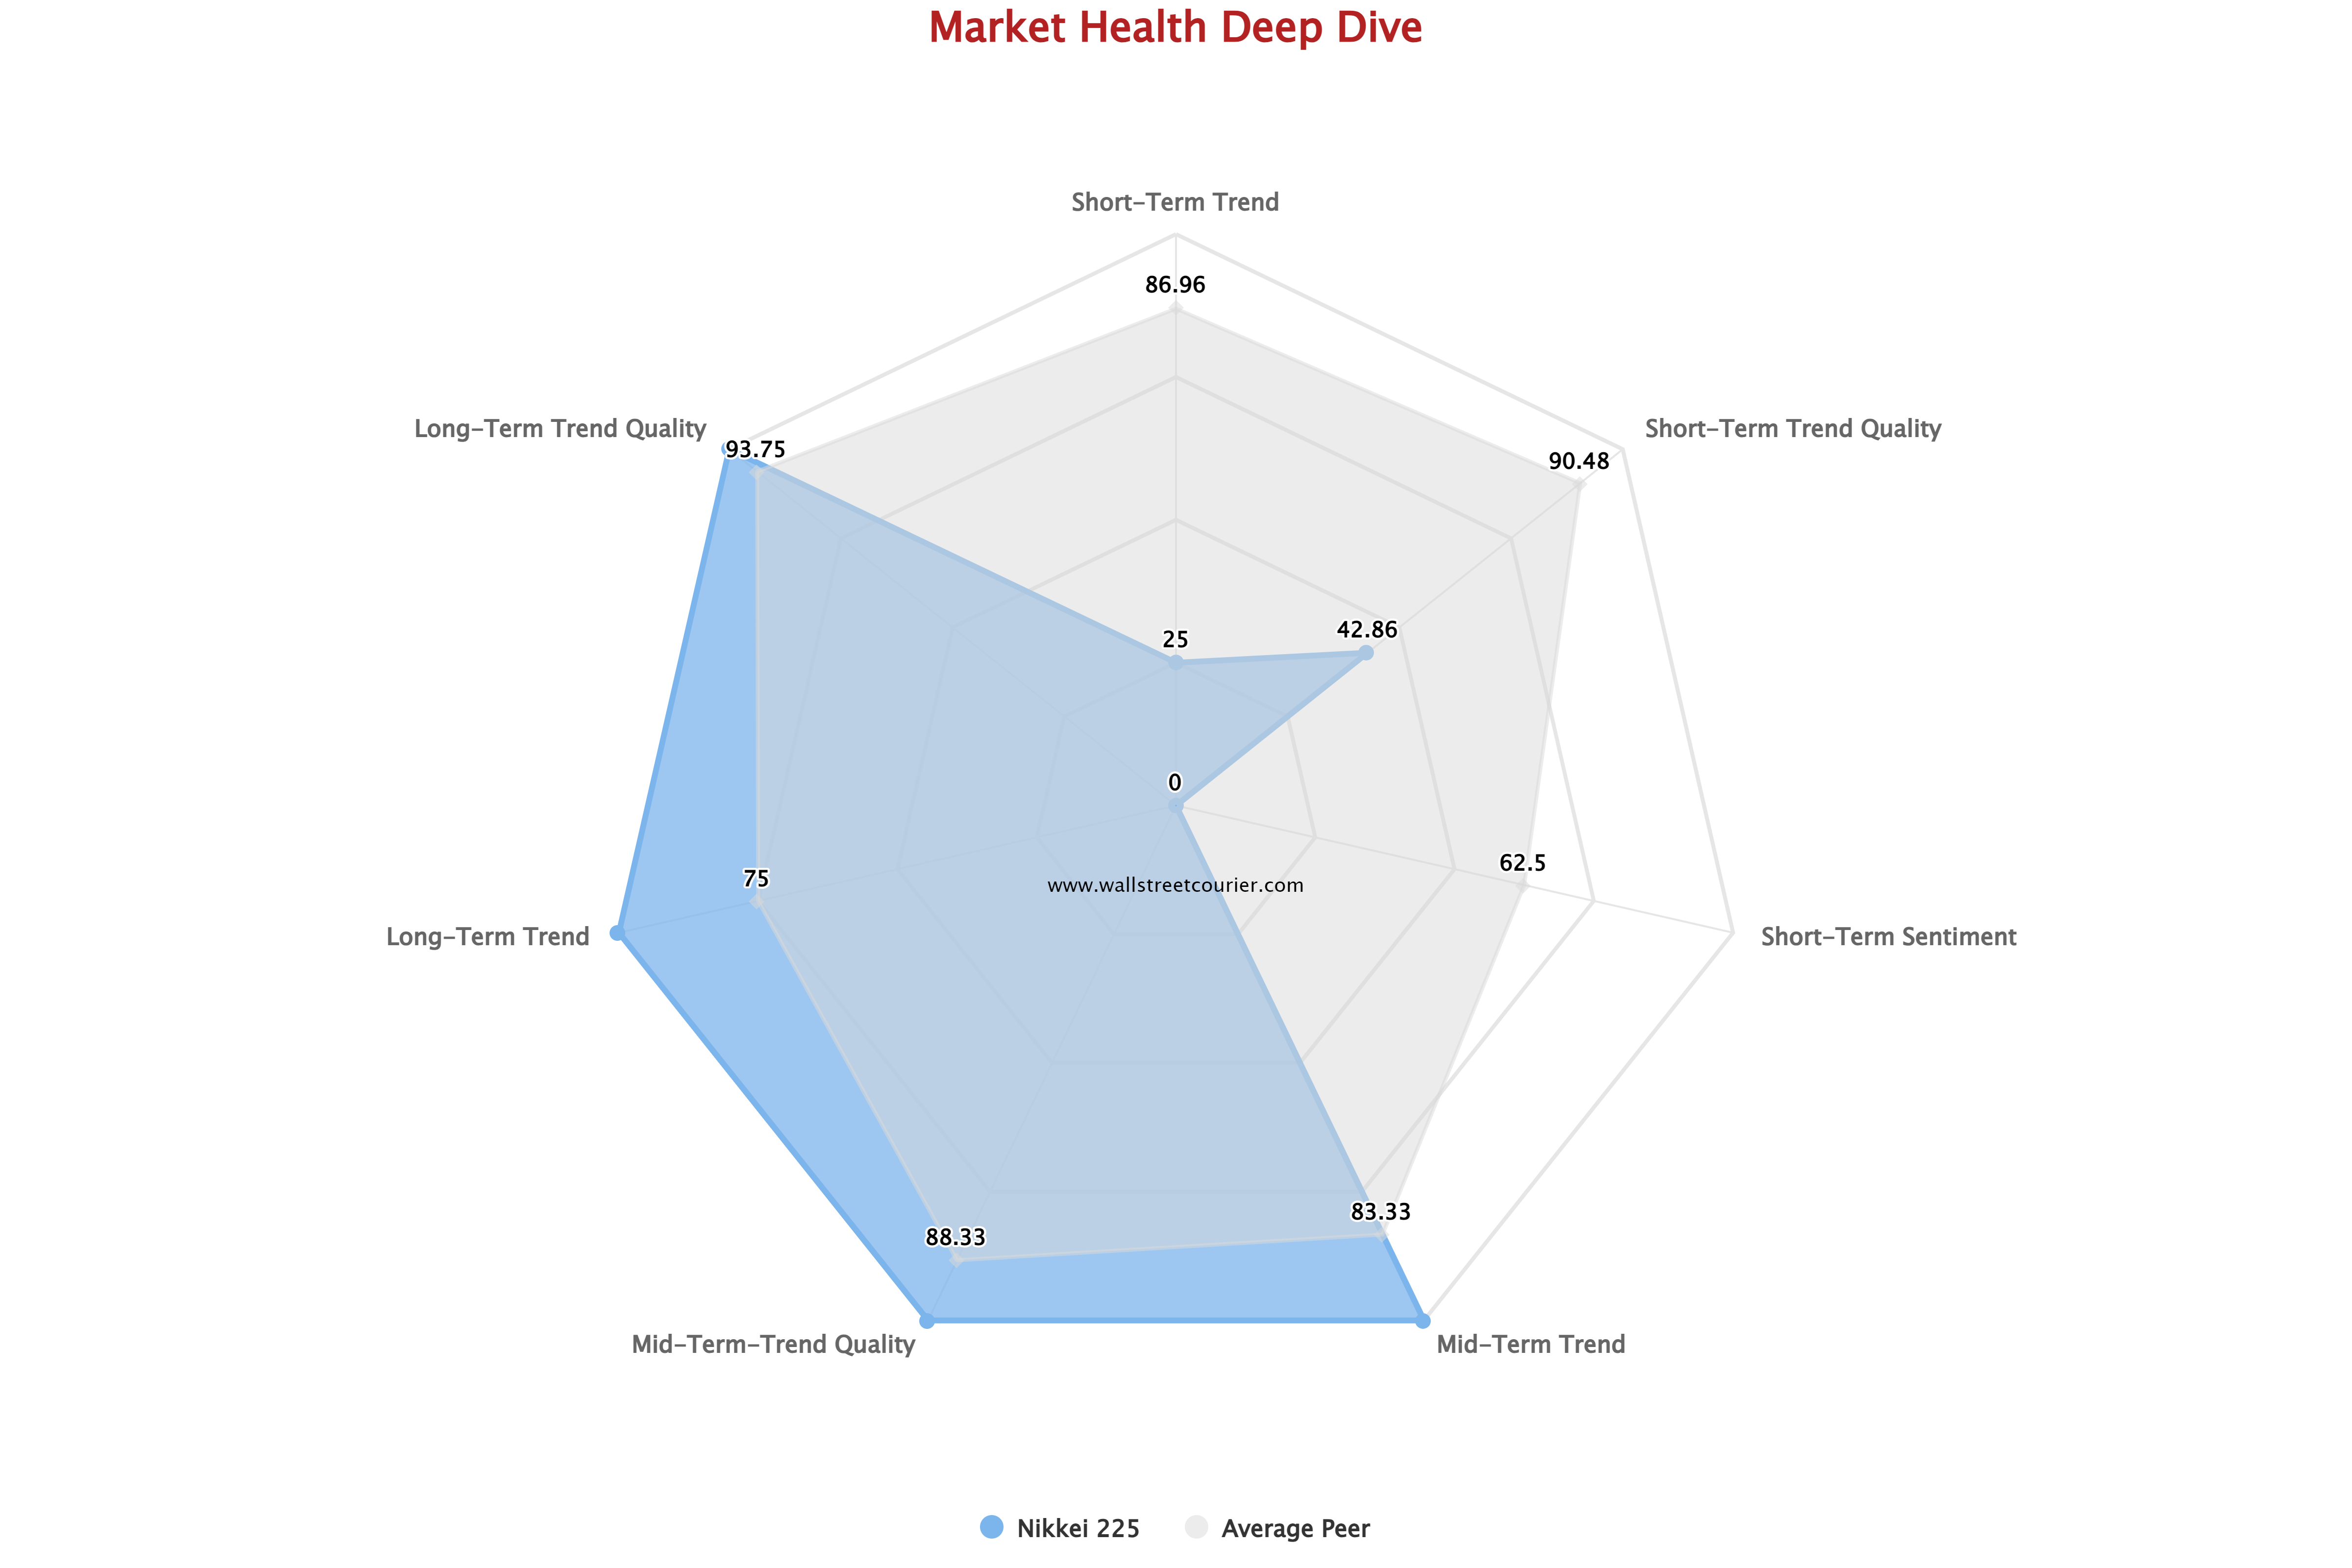
This is also illustrated in the spider charts below, which show the current strength of each component (trend, trend quality, and sentiment). Here, we can observe that the current trend, trend quality, and sentiment in the Nikkei 225 have only weakened on a short-term basis, while maintaining robust readings from a mid- to long-term perspective. This is a typical behavior of a healthy pause, as the consolidation is mainly driven by short-term profit-taking rather than by strategic selling pressure.

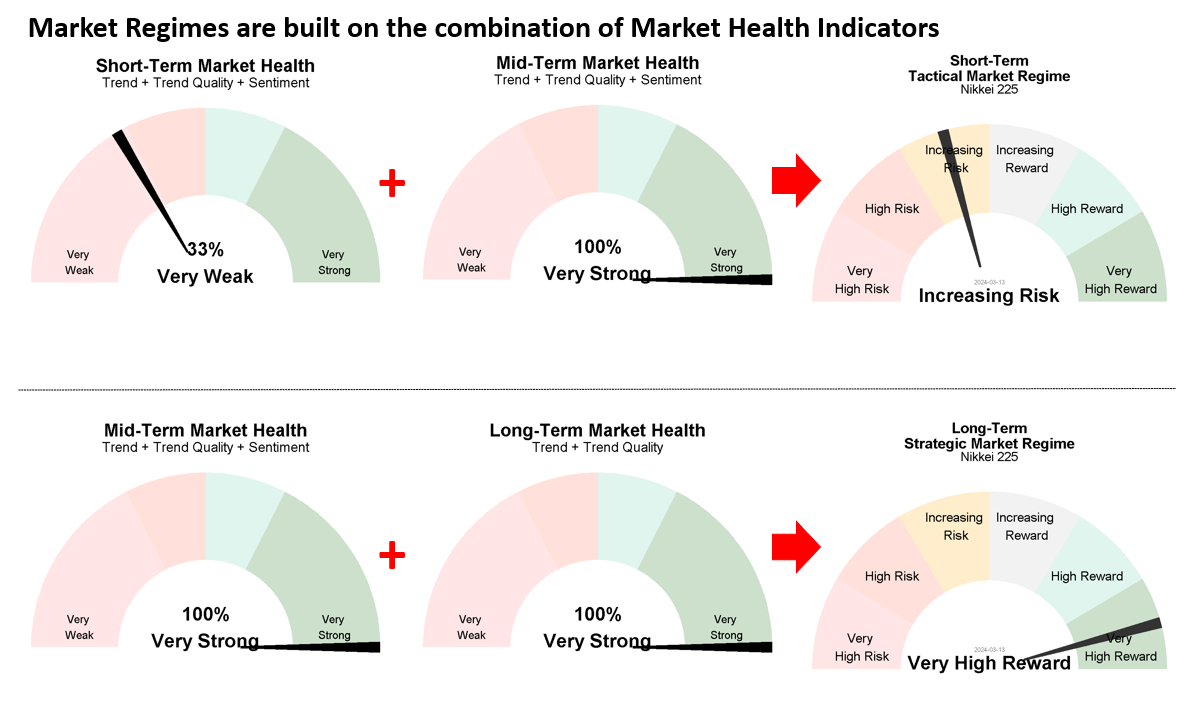
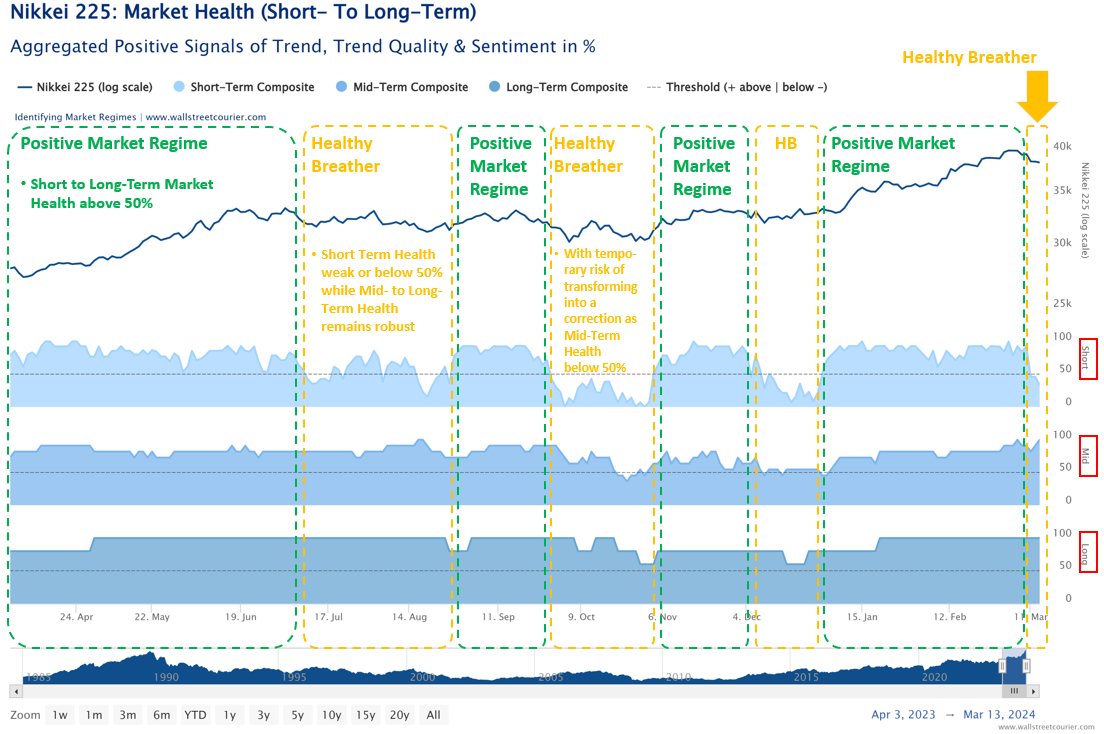
To monitor these performance factors over time, these signals are then combined into Market Health Indicators (as seen in the chart below). These indicators are representing composites of these signals for three different timeframes. Scores on a 0 to 100% scale denote signal positivity. Values below 50% indicate a negative outlook, while those above 50% signal positive market health. The combination of these health indicators results in market regimes, indicating the strength of the current trend for a specific timeframe.

The chart above illustrates the Nikkei 225 in the first panel, followed by three subsequent panels detailing Short-, Mid-, and Long-Term Market Health over time. During the shown time span from April 2023 until March 2024, the Nikkei mostly maintained a ‘Very High Reward’ market regime across both short- and long-term perspectives. These market regimes were driven by Short-, Mid-, and Long-Term Market Health Indicators consistently exceeding the 50% threshold, indicating a robust trend supported by a broad range of stocks in the index and confirmative smart money positioning.

In several instances, Short-Term Market Health declined below the 50% threshold, signaling a dearth of positive signals in trend, trend quality, and sentiment over the short term. However, Mid- to Long-Term Market Health remained resilient. Such combinations trigger ‘Short-Term Increasing Risk’ market regimes, while maintaining a ‘Very High Reward’ market regime for the long-term. This is typical when the market is taking a healthy pause after a period of stronger gains, as sentiment typically reaches extremely positive levels. Thus, nobody is left to push prices higher.

How to spot high-reward & low risk market opportunities

3 Steps for Determining Market Regimes

With our structured approach, we can identify the respective market regime for any market. Our methodology include the following steps:

1

Identify Robust Trends

  • Trends are measured through a systematic screening of signals from multiple indicators (for example the WSC Trend Index, the Smart Money Flow Index or the Daily Put-/Call Ratio All CBOE Options)
  • These indicators cover various categories (trend, trend quality, and sentiment, including dumb- and smart-money positioning) and timeframes.
  • This diversified approach minimizes the impact of noise in individual indicators and enables an unbiased and robust view of current market conditions.
2

Monitor Market Health

  • These indicators are representing composites of these signals for three different timeframes.
  • Scores on a 0 to 100% scale denote signal positivity.
  • Values below 50% indicate a negative outlook, while those above 50% signal positive market health.
  • The combination of these health indicators results in market regimes, indicating the strength of the current trend for a specific timeframe.

3

Determine Market Regimes

  • By combining short- to mid-term and mid-term to long-term market health readings, the specific market regime is determined.
  • These Market Regime gauges help identify market regimes and shifts without the hassle of going through all indicator signals.
  • To be more precise, the Tactical Short-Term Market Regime is constructed upon the combination of short- to mid-term market health, while the Strategic Long-Term Market Regime is based on the amalgamation of mid- to long-term market health.

In a shorter-term perspective, the trend turns negative, which is supported by a wide range of negatively performing stocks within that market. Given the fact that the trend and the trend quality on a longer time perspective are still strong, the market is getting back on track when sentiment turns fearful. This shift causes the short-term market regime to revert back to its ‘Very High Reward’ regime.

While short-term market regimes matter for swing-traders, long-term market regimes are preferred by more opportunistic buy-and-hold oriented investors. In the chart above, we see that – with the exception of a few days in late October 2023 – the Nikkei 225 has consistently maintained a positive ‘Long-Term Very High Reward’ market regime throughout the shown time span. This regime is characterized by Mid- to Long-Term Market Health readings consistently above 50%.

Not surprisingly, the Nikkei 225 has delivered an impressive 37% return during this time period. Importantly, the current long-term market regime remains robust, indicating no cause for concern among long-term oriented investors—at least for now.

From Market Health Indicators To Market Regimes:

This positive long-term market enironment is reflected in our Market Regimes Gauges below. By combining short- to mid-term and mid-term to long-term market health readings, the specific market regime is determined. These Market Regime gauges help identify market regimes and shifts without the hassle of going through all indicator signals. To be more precise, the Tactical Short-Term Market Regime is constructed upon the combination of short- to mid-term market health, while the Strategic Long-Term Market Regime is based on the amalgamation of mid- to long-term market health.

What the history tells us about the current Market Regimes

Currently, the short-term shift in the market regime for the Nikkei 225 appears to be a routine pause following a period of robust growth. Since 1985, the Nikkei 225 has transitioned into the ‘Short-Term Increasing Risk’ market regime 385 times. Notably, in 79% of these instances, the index experienced a decline, averaging a loss of 1.8%. During these periods, the average volatility measured 19%.
Conversely, the long-term perspective reveals a consistently favorable outlook, with the index maintaining a ‘Very High Reward’ market regime’. This regime boasted a 71.7% win rate, delivering average returns of 3.1%. Remarkably, the highest return observed within this regime was 38.2%, still leaving enough room to grow when considering current returns.

The Bottom Line

  • With persistently positive Mid- to Long-Term Market Health Indicators, the recent slowdown just looks like a healthy pause on the way higher. Thus, we expect that momentum will pick up soon as the index is still supported by a wide range of stocks maintaining a strong uptrend. This view aligns with the current market regime combination, which typically occurs during a healthy pause within a sustained uptrend.
  • Looking at past data, highly leveraged investors should consider closing their positions when a market enters a ‘Short-Term Increasing Risk’ market regime, due to the poor average returns in this phase. Given the fact that the downside potential is quite capped, a range trading approach might be quite an attractive strategy in such a market environment. 
  • Strategic long positions can be established again when the market shifts back to a ‘Very High Reward’ market regime. On the other hand, long-term investors might see this pause as an opportune entry point to tap into this promising niche, relying on the continued strength of Mid- to Long-Term Market Health.

Want our Market Regime Trend Analysis sent directly to your mailbox?

Market Regime Newsletter

In our Market Regime Newsletter, we provide analyses of specific markets using our approach to deliver precise outlooks. This showcases our consistent research approach and enables users to efficiently apply our indicators and tools to analyze any market.

Subscribe to our Market Regime Newsletter