This is the Logo of WallStreetCourier

Trend Analysis, Market Regime Review, and Outlook on the Nasdaq 100 (NDX)

Market Regime Newsletter

A quick glimpse into our market research

Sample Research

Here’s a sample of our Market Regime Newsletter, where we analyze specific markets using our precise approach. This showcases our consistent research and enables users to efficiently apply our indicators and tools to any market.

Key Points:

This Market Regime Newsletter was issued on May 19th, 2024

  • The Nasdaq 100 surged to record highs following lower-than-expected inflation metrics, providing a general boost to equities.
  • Despite reaching record highs, the Nasdaq’s outlook is clouded by uncertainties surrounding inflation dynamics and the Federal Reserve’s monetary policy stance. Hawkish remarks by Fed officials at the end of the week, pointing towards a scenario of higher rates for longer, added to the ambiguity regarding potential rate cuts.
  • The comparison of record-high Nasdaq levels with concerns about prolonged inflationary pressures underscores the fragility of the current market environment from a macroeconomic perspective.
  • Despite macroeconomic challenges, our data suggests that the current uptrend remains resilient.
  • This view is supported by the current market regime for the Nasdaq 100, which indicates a ‘Very High Reward’ market regime for both short-term and long-term perspectives. This suggests a strong uptrend backed by high trend quality and increasing smart money positions.

Description of the current Market Regime for the Nasdaq 100:

Our definition of market regimes is rooted in a thorough analysis of multiple indicators with high predictive power. These indicators comprehensively cover the most essential performance factors, including trend, trend quality, sentiment, as well as the positions of both smart and dumb money. Market regimes are determined by the percentage of positive signals among these indicators, considering their respective time frames. In total, we have six predefined regimes ranging from ‘Very High Reward’ to ‘Very High Risk,’ each with its own distinct risk-reward characteristics. This framework enables investors to swiftly adapt their portfolio to new circumstances.

Currently, the Nasdaq 100 is in a ‘Very High Reward’ market regime for both short- and long-term perspectives. This translates into an robust uptrend on all timeframes. Prices consistently show an upward trend, supported by a wide range of well-performing stocks within that market. Even in the face of negative news, the market demonstrates remarkable resilience with such a high positive trend quality. Weak trading days are typically short-lived overbought or sentiment driven reactions, leaving the market better positioned for further gains.

Driving Forces Behind the Current Market Regime:

As illustrated in the flow chart below, the Nasdaq 100 shows minimal negative signals across critical metrics like trend, trend quality, and sentiment (including smart- and dumb money positioning). The flow chart is a very useful tool to analyze indicator signals based on their category and timeframe to identify the current trend strength and trend direction.

Typically, a major trend reversal begins with Smart Money reducing positions, while Dumb Money remains overly optimistic. Subsequently, we often witness a pronounced decline in trend quality, indicating that the majority of stocks in the index are already faltering, despite the seemingly strong index prices. This narrow leadership makes the uptrend vulnerable to negative macroeconomic news flow, which can act as the trigger for a significant trend reversal. However, none of these patterns are currently evident, indicating that the overall uptrend remains robust.

Analyzing the Market Environment of the Nasdaq 100 over time

Aggregating these signals over time provides a more precise assessment of the current technical condition of the Nasdaq 100. Below, our Market Health Indicators incorporate all trend, trend quality (also known as breadth), and sentiment signals across different timeframes for an unbiased trend analysis. Scores on a 0 to 100% scale denote signal positivity, with values above 50% indicating a positive outlook and values below 50% indicating a negative one.

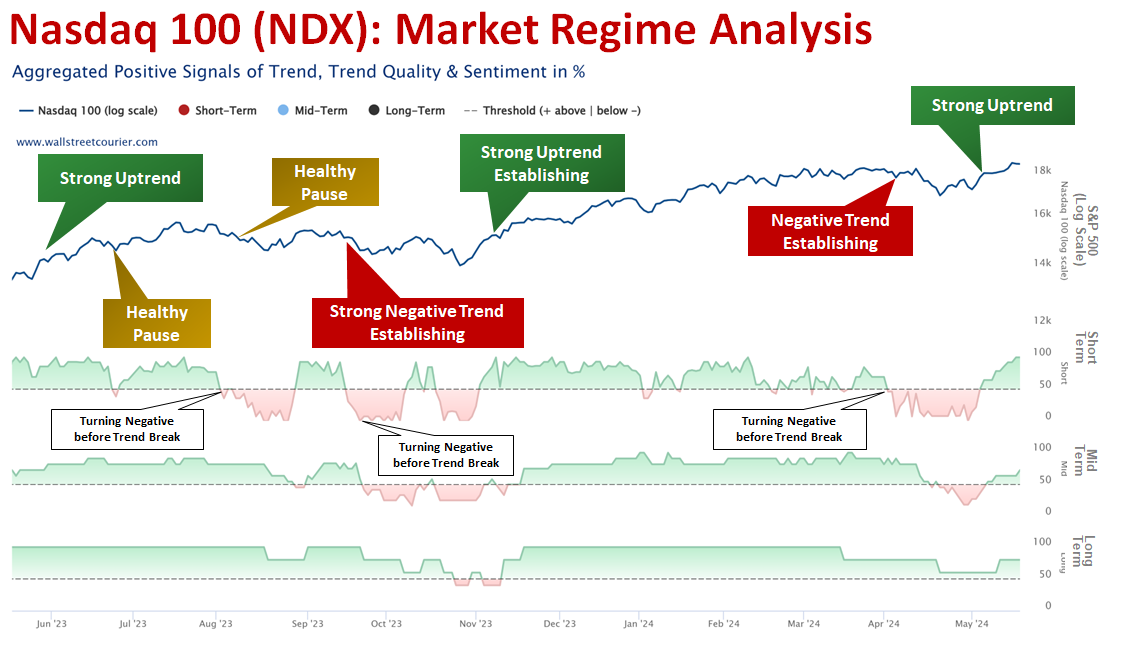
The chart below illustrates the Nasdaq 100 (NDX) in the first panel, followed by three subsequent panels detailing Short-, Mid-, and Long-Term Market Health trends over time.

With readings of our Short- to Long-Term Market Health Indicators mostly above 50%, the market environment for the Nasdaq 100 was predominantly positive during the shown time period above. It’s noteworthy that the Nasdaq 100 recorded a substantial advance of nearly 40% during this period.

However, this upward trend faced three distinct periods of weakness, evident from our Market Health Indicators falling below the 50% threshold. The first instance occurred in August 2023. Despite the Nasdaq 100 reaching a new high just days earlier, our Short-Term Market Health dropped significantly below 50%, signaling a shift in short-term indicators towards negativity. Indeed, the Nasdaq 100 faced a period of weaknesses shortly afterwards.

Given the fact that Mid- to Long-Term Market Health remained strong, such declines are typically just temporary pauses in an ongoing bull market rather than the start of a major downturn. Thus, it was not a big surprise to see another rally attempt into September 2023. The situation varied slightly from late September to early November 2023 and in early April 2024 until early May 2024. In both cases, the significant deterioration of Short-Term Market Health served as an early warning of potential troubles before index prices turned negative.

How to spot high-reward & low risk market opportunities

3 Steps for Determining Market Regimes

With our structured approach, we can identify the respective market regime for any market. Our methodology include the following steps:

1

Identify Robust Trends

  • Trends are measured through a systematic screening of signals from multiple indicators (for example the WSC Trend Index, the Smart Money Flow Index or the Daily Put-/Call Ratio All CBOE Options)
  • These indicators cover various categories (trend, trend quality, and sentiment, including dumb- and smart-money positioning) and timeframes.
  • This diversified approach minimizes the impact of noise in individual indicators and enables an unbiased and robust view of current market conditions.
2

Monitor Market Health

  • These indicators are representing composites of these signals for three different timeframes.
  • Scores on a 0 to 100% scale denote signal positivity.
  • Values below 50% indicate a negative outlook, while those above 50% signal positive market health.
  • The combination of these health indicators results in market regimes, indicating the strength of the current trend for a specific timeframe.

3

Determine Market Regimes

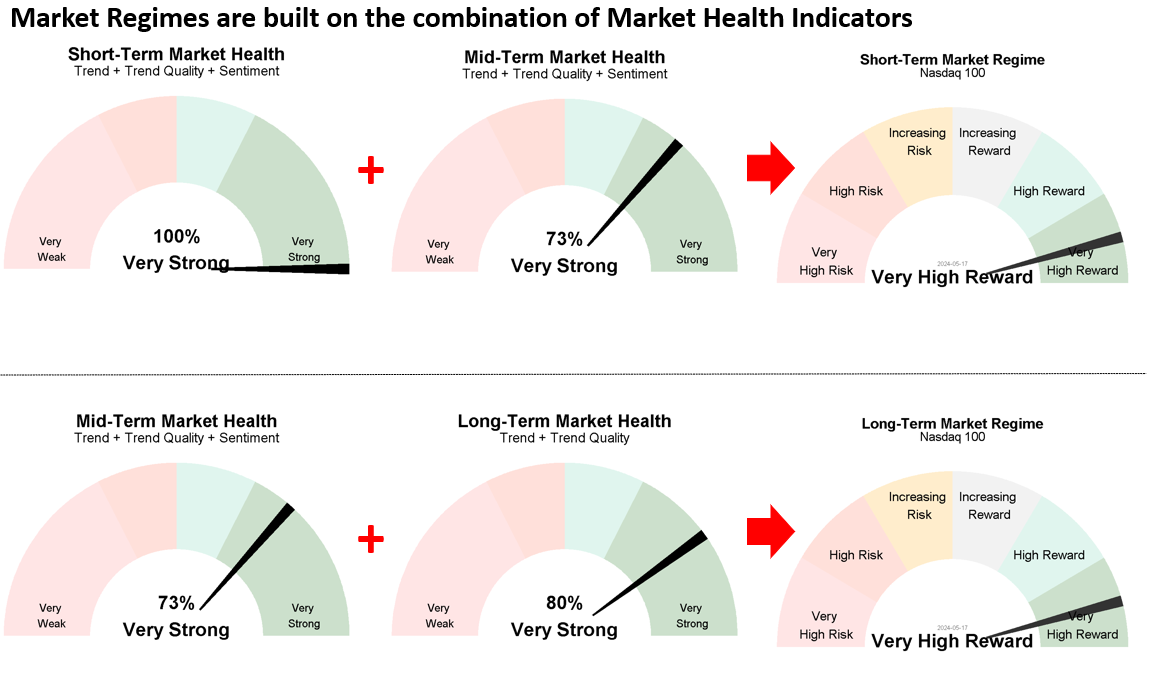
  • By combining short- to mid-term and mid-term to long-term market health readings, the specific market regime is determined.
  • These Market Regime gauges help identify market regimes and shifts without the hassle of going through all indicator signals.
  • To be more precise, the Tactical Short-Term Market Regime is constructed upon the combination of short- to mid-term market health, while the Strategic Long-Term Market Regime is based on the amalgamation of mid- to long-term market health.

Additionally, Mid-Term Market Health exhibited stronger signs of deterioration by dropping below 50% during these periods. These patterns are typical ingredients for a correction, as the majority of underlying constituents in the index showed a negative trend structure on multiple timeframes. In such a situation, investors should exit or should not start going on a buying spree, as the risk of stronger and prolonged losses remains high. Indeed, In October 2023, the Nasdaq 100 experienced a 10% loss, while the pullback in April 2024 was slightly less severe at 7%.

Currently, Short- to Long-Term Market Health readings indicate exceptional strength, ranging between 75% and 100%. This underscores the robust nature of the current uptrend in the Nasdaq 100, driven by a majority of stocks in the index, healthy volume flows into the market, and expanding smart money positions. As long as we do not see a significant deterioration below 50% within Short- and Mid-Term Market Health, the outlook for the Nasdaq 100 remains compelling even in the face of negative macroeconomic news flow.

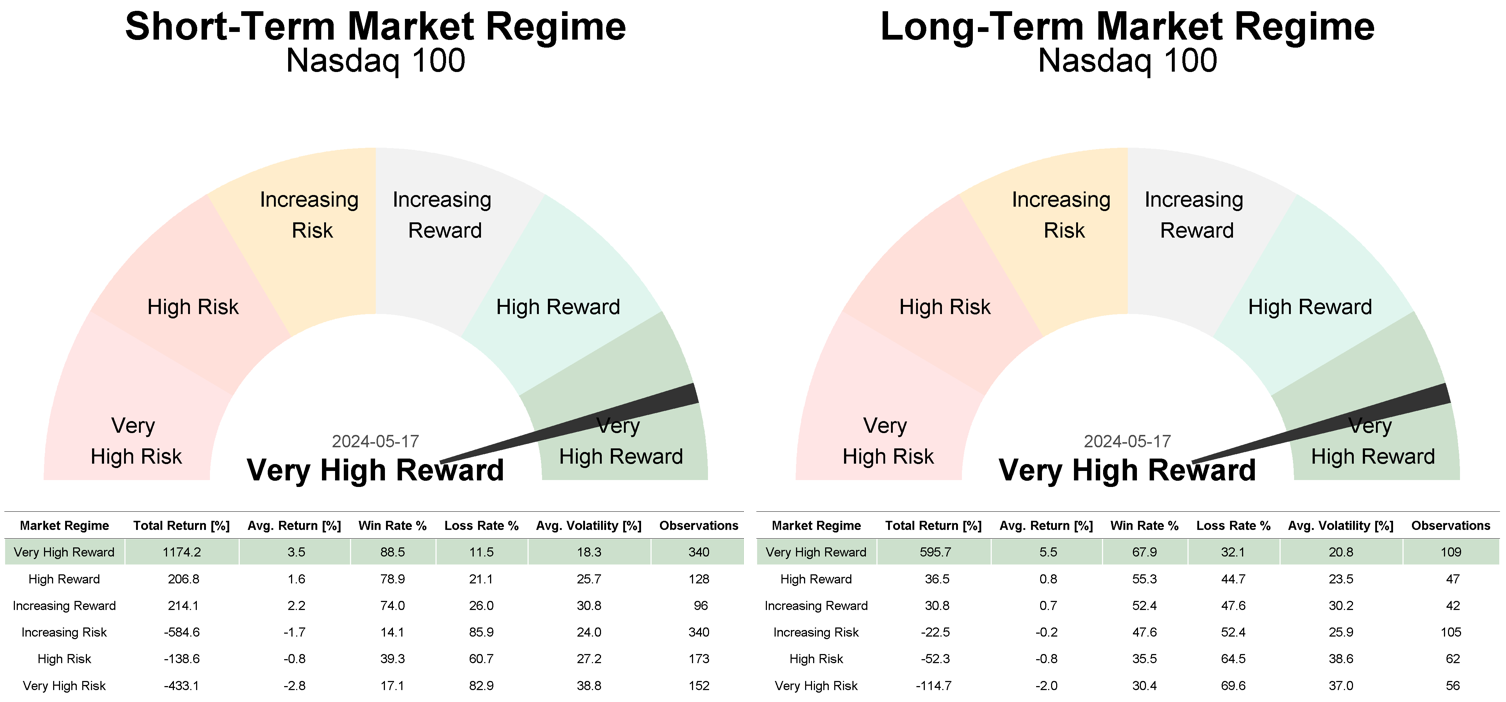
This positive market environment is reflected in our Market Regimes Gauges below. By combining short- to mid-term and mid-term to long-term market health readings, the specific market regime is determined. These Market Regime gauges help identify market regimes and shifts without the hassle of going through all indicator signals. To be more precise, the Tactical Short-Term Market Regime is constructed upon the combination of short- to mid-term market health, while the Strategic Long-Term Market Regime is based on the amalgamation of mid- to long-term market health.

What the history tells us about the current Market Regimes

Since the availability of full market regime data dating back to 1996, the Nasdaq 100 has entered a ‘Very High Reward’ market regime 340 times from a tactical point of view and 109 times strategically. These market regimes are categorized by Short- To Long-Term Market Health Readings above 50%. Remarkably, in 88.5% of these instances, the Nasdaq 100 yielded a total cumulative gain of 1174% for short-term traders and 595% for strategic long-term-oriented investors during that time period.

The Bottom Line and Outlook

Considering the robust trend and trend quality observed across multiple timeframes, the current uptrend in the Nasdaq 100 appears exceptionally strong as it is driven by a broad basis. These are the main ingredients for a robust uptrend. Therefore, any potential weaknesses ahead are likely just temporary pauses on the way higher — provided that Mid- to Long-Term Market Health Indicators continue to show strength.

Want our Market Regime Trend Analysis sent directly to your mailbox?

Market Regime Newsletter

In our Market Regime Newsletter, we provide analyses of specific markets using our approach to deliver precise outlooks. This showcases our consistent research approach and enables users to efficiently apply our indicators and tools to analyze any market.

Subscribe to our Market Regime Newsletter