The Official Source for Bloomberg Professional
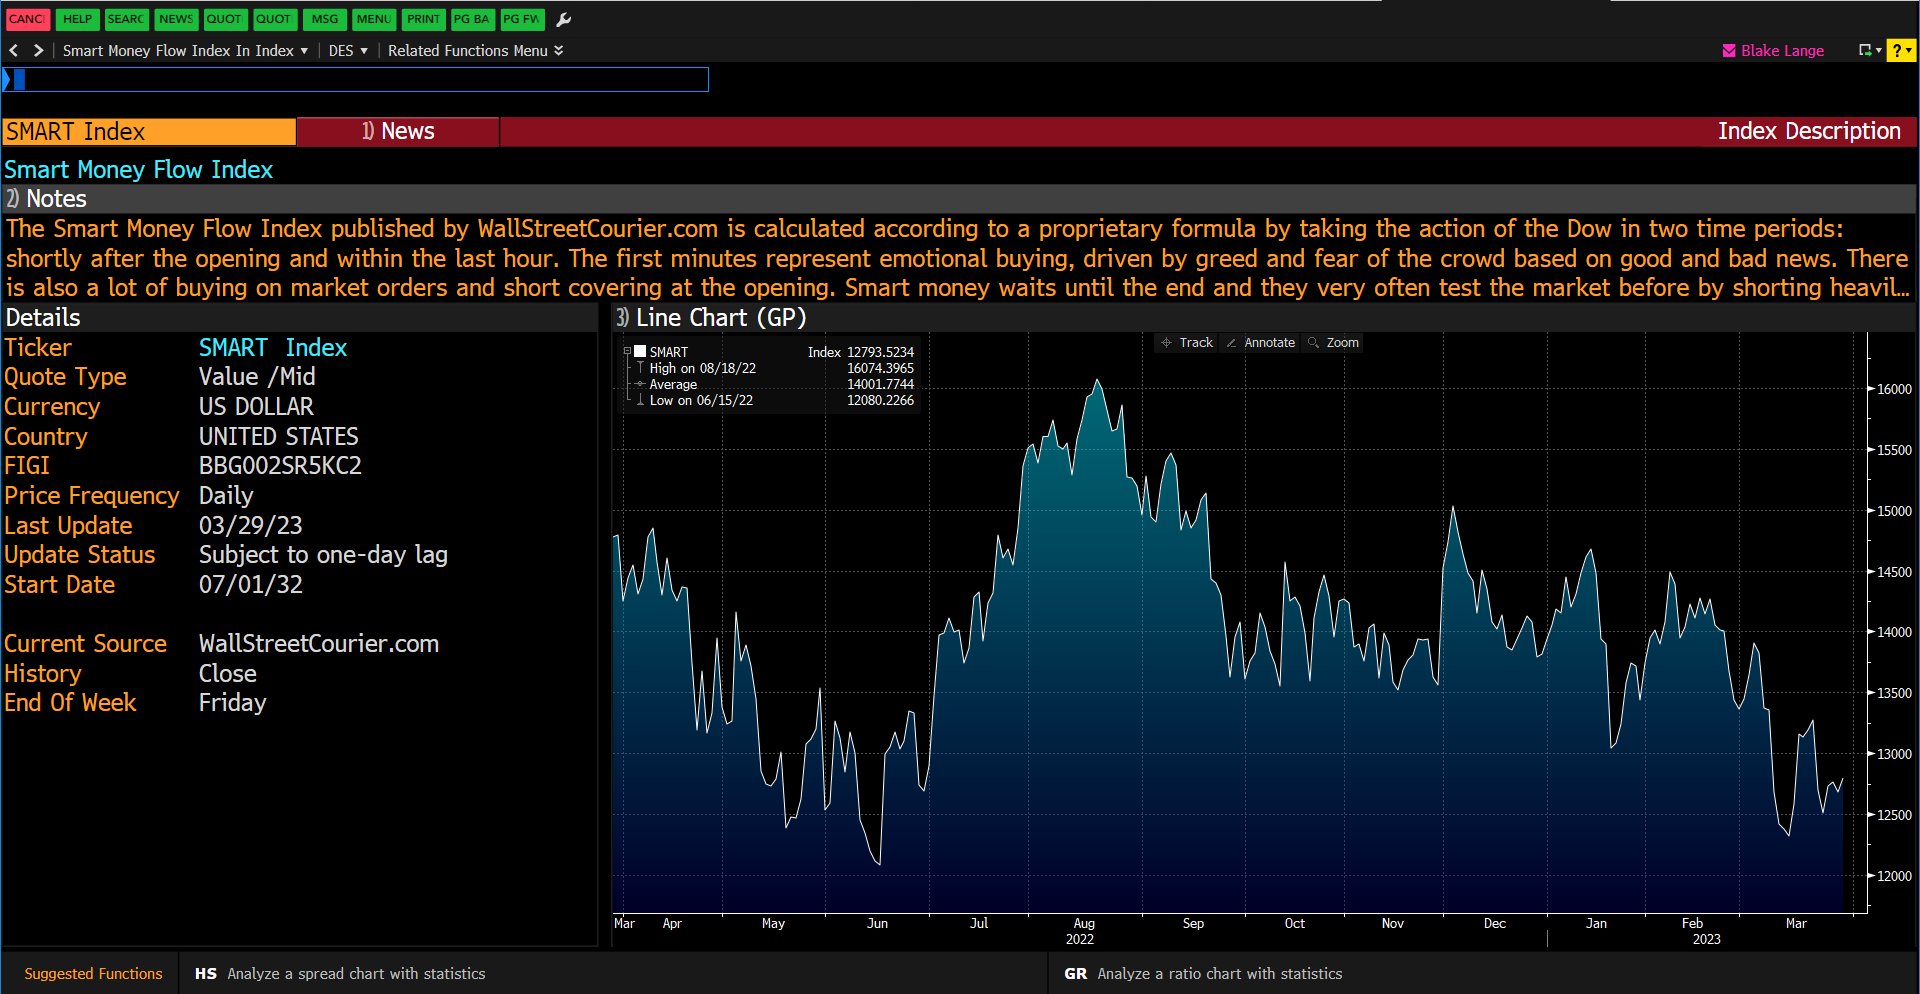
The Smart Money Flow Index (SMFI) has long been one of the best kept secrets of Wall Street. Almost everyone has heard of “Smart Money”, “Dumb Money” and the so called “Crowd”, and that is exactly what our indicators are all about. Top performing money managers, savvy investors and institutional asset managers are relying on them. One of them is the Smart Money Flow Index for instance, which is also featured on the BLOOMBERG PROFESSIONAL Service under SMART <Index> <GO>.
Just ask yourself these questions: Would you be a buyer if you see that the public and the option market (dumb money) go on a buying spree while the “Smart Money” are heavily short at the same time? Do you know when to part company with the crowd and take profits? The key is to know when the smart guys are trend-following or contrarian. This is exactly what our research is specalized in. We publish the Smart Money Flow Index for free just to give you a glimpse of an idea about the research we offer in our members section.
Free Daily Updated Smart Money Flow Index
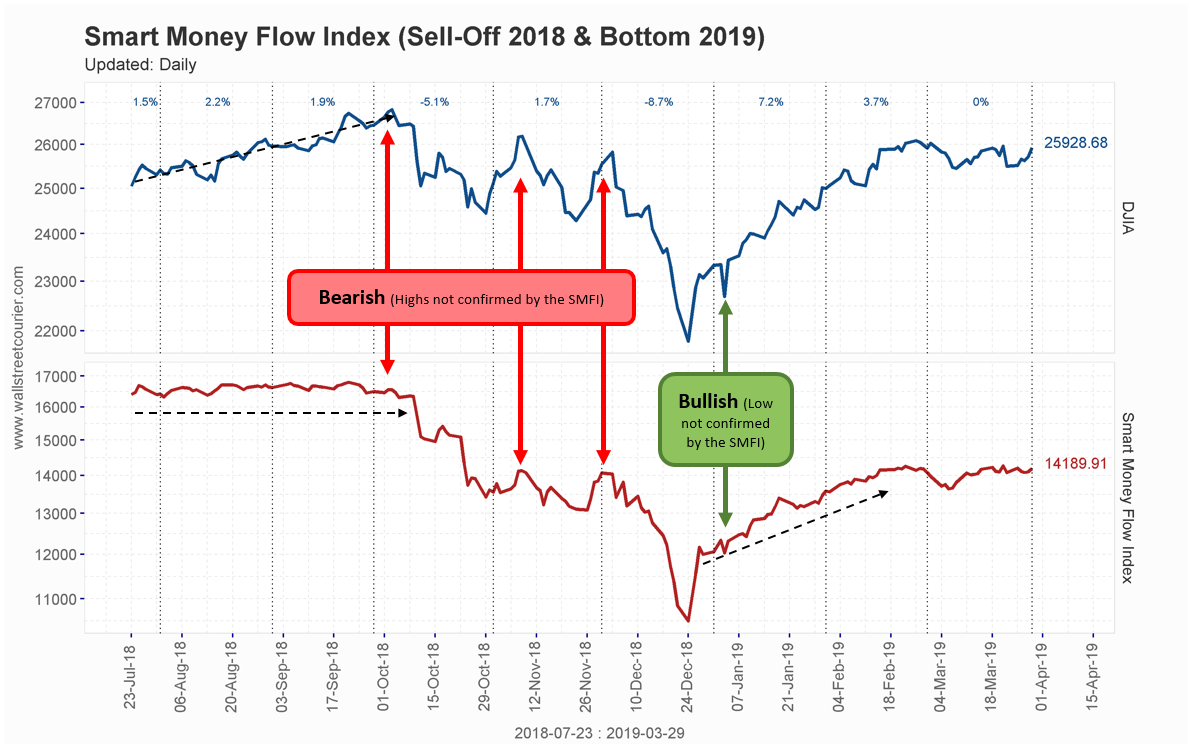
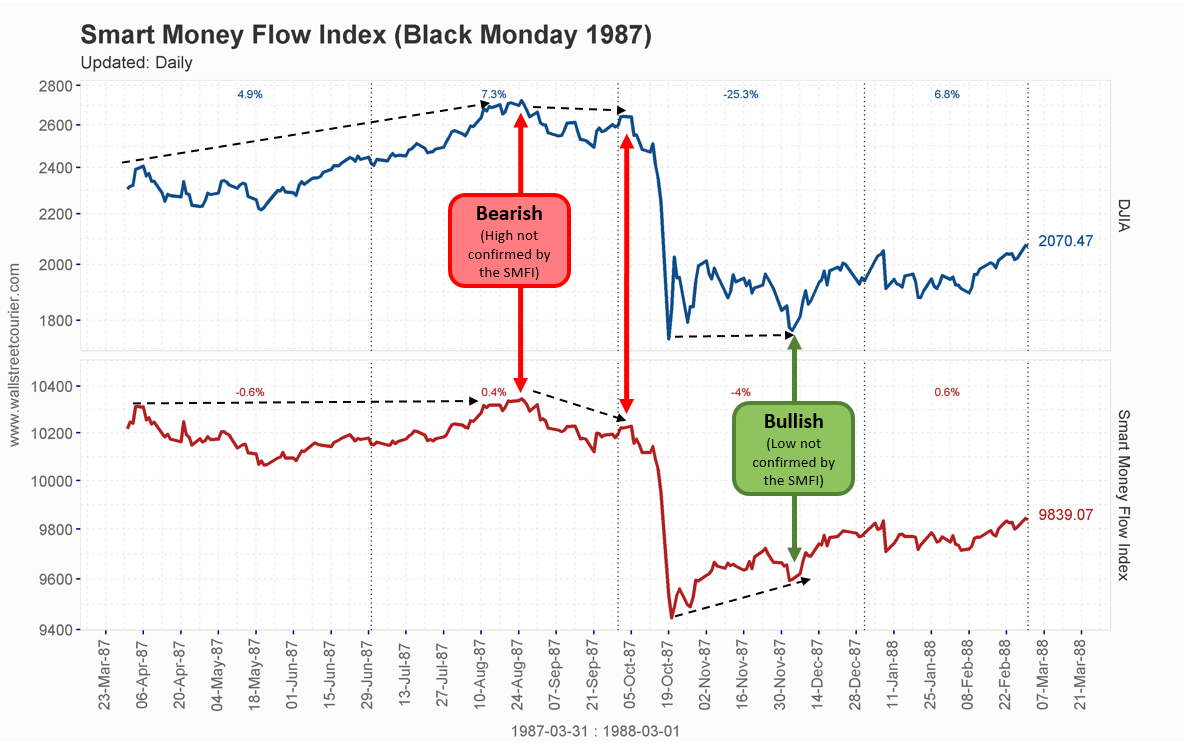
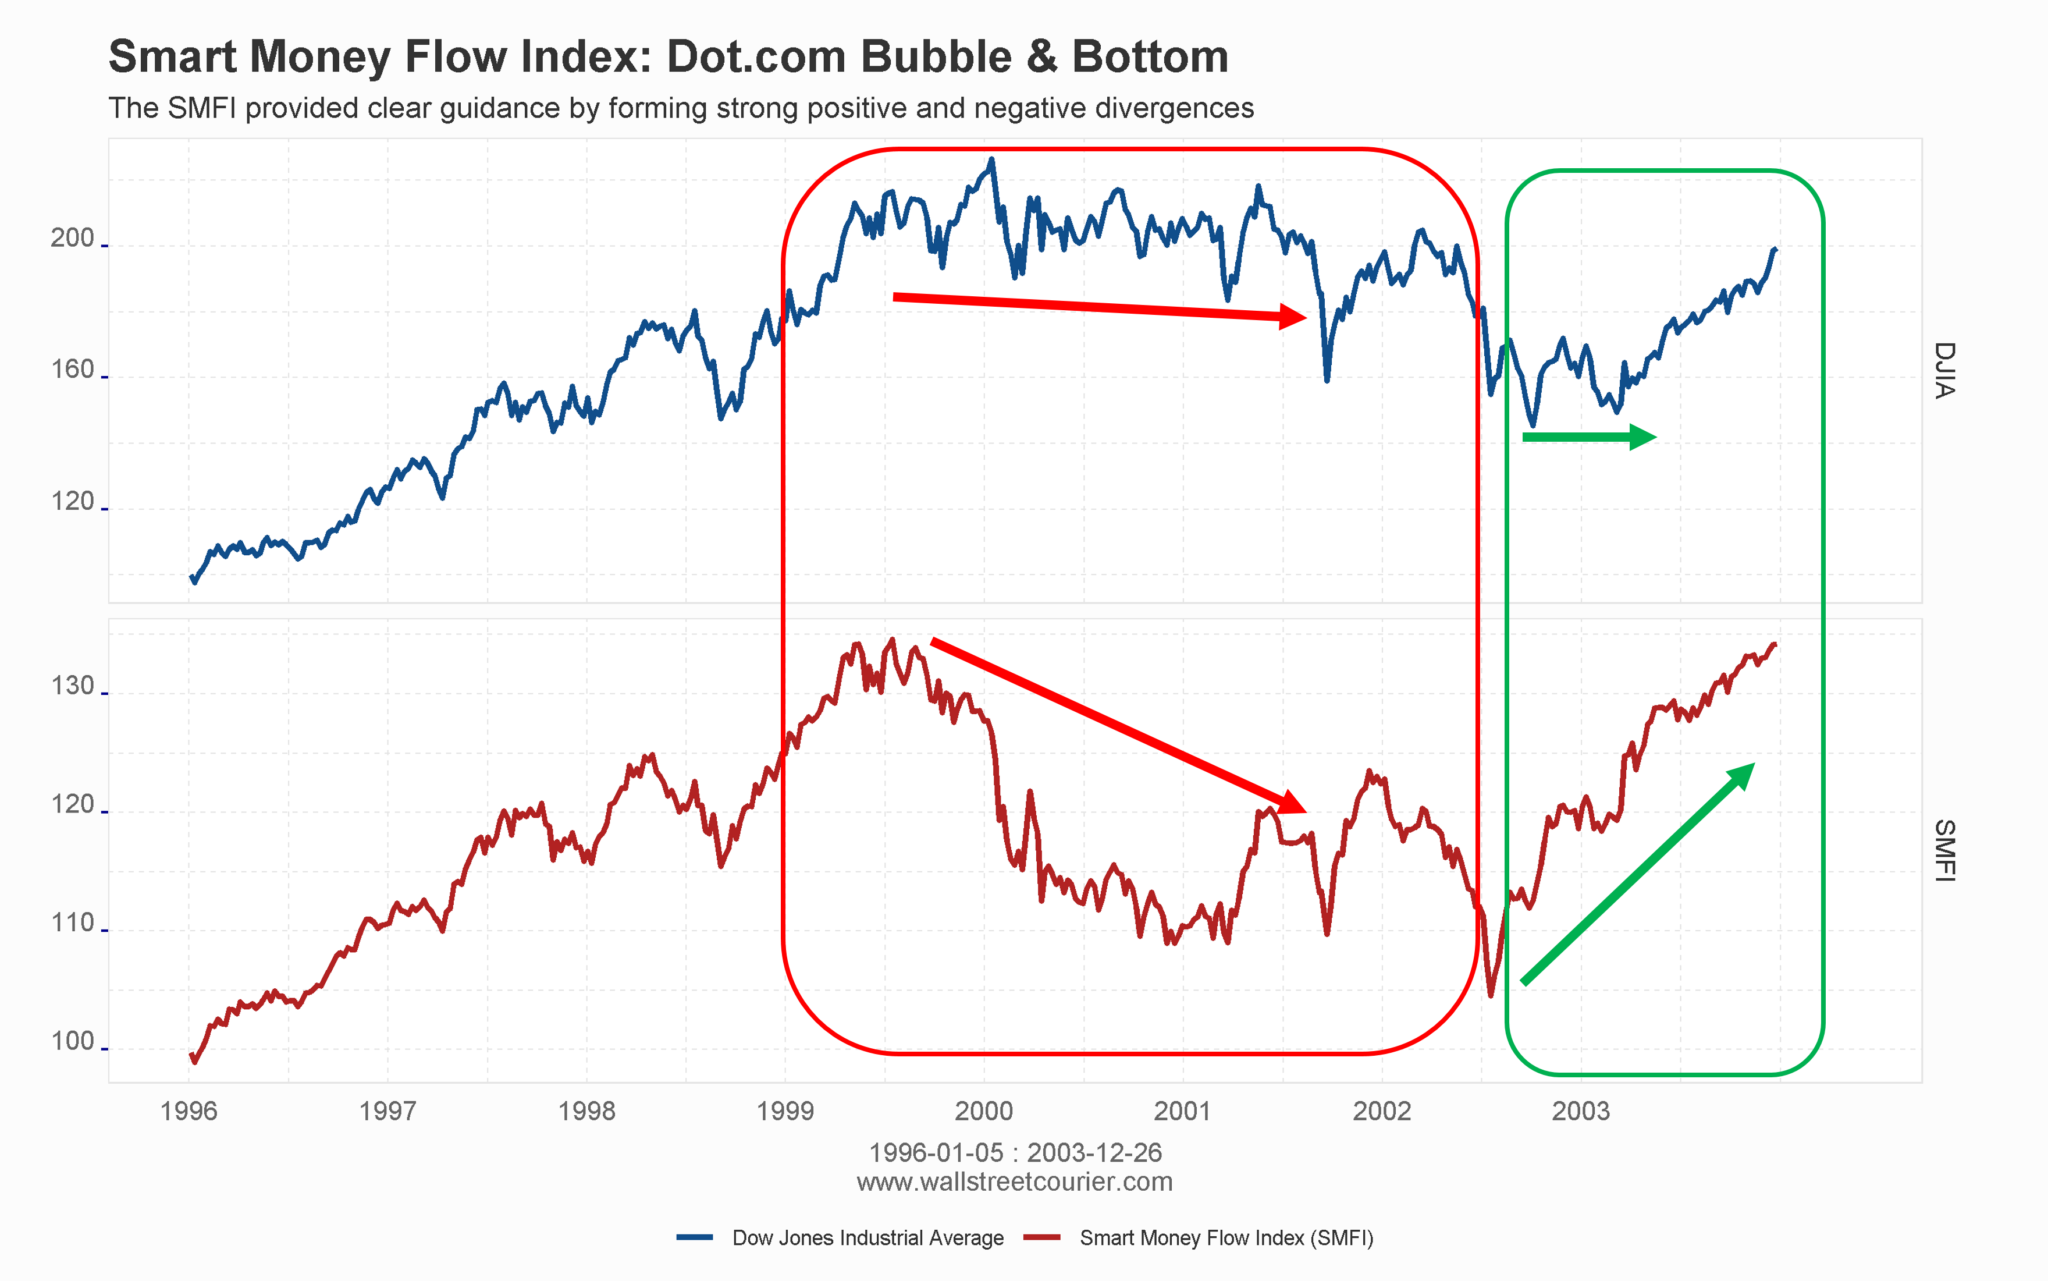
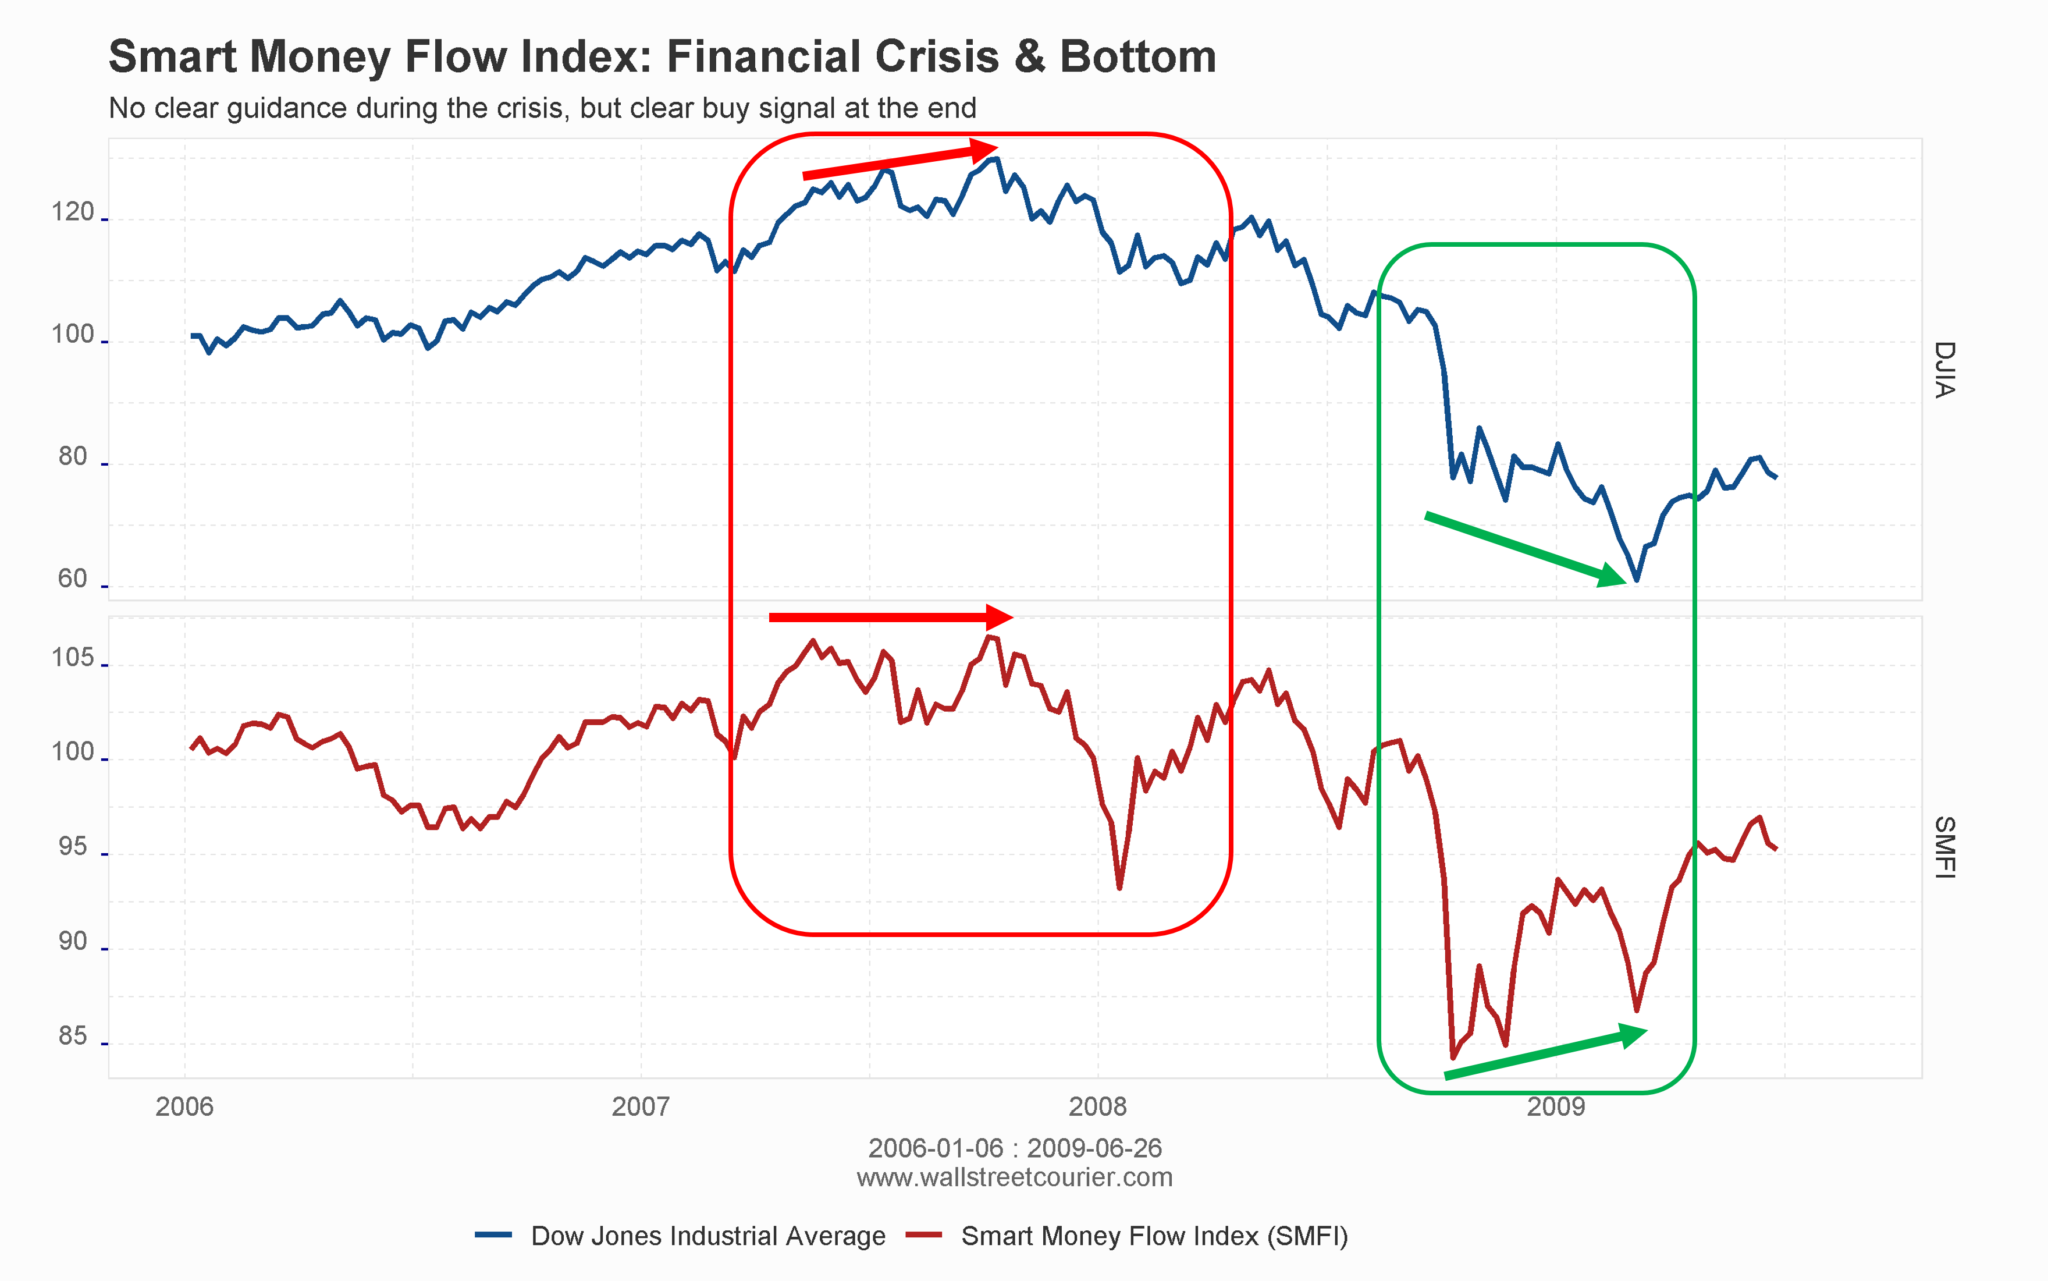
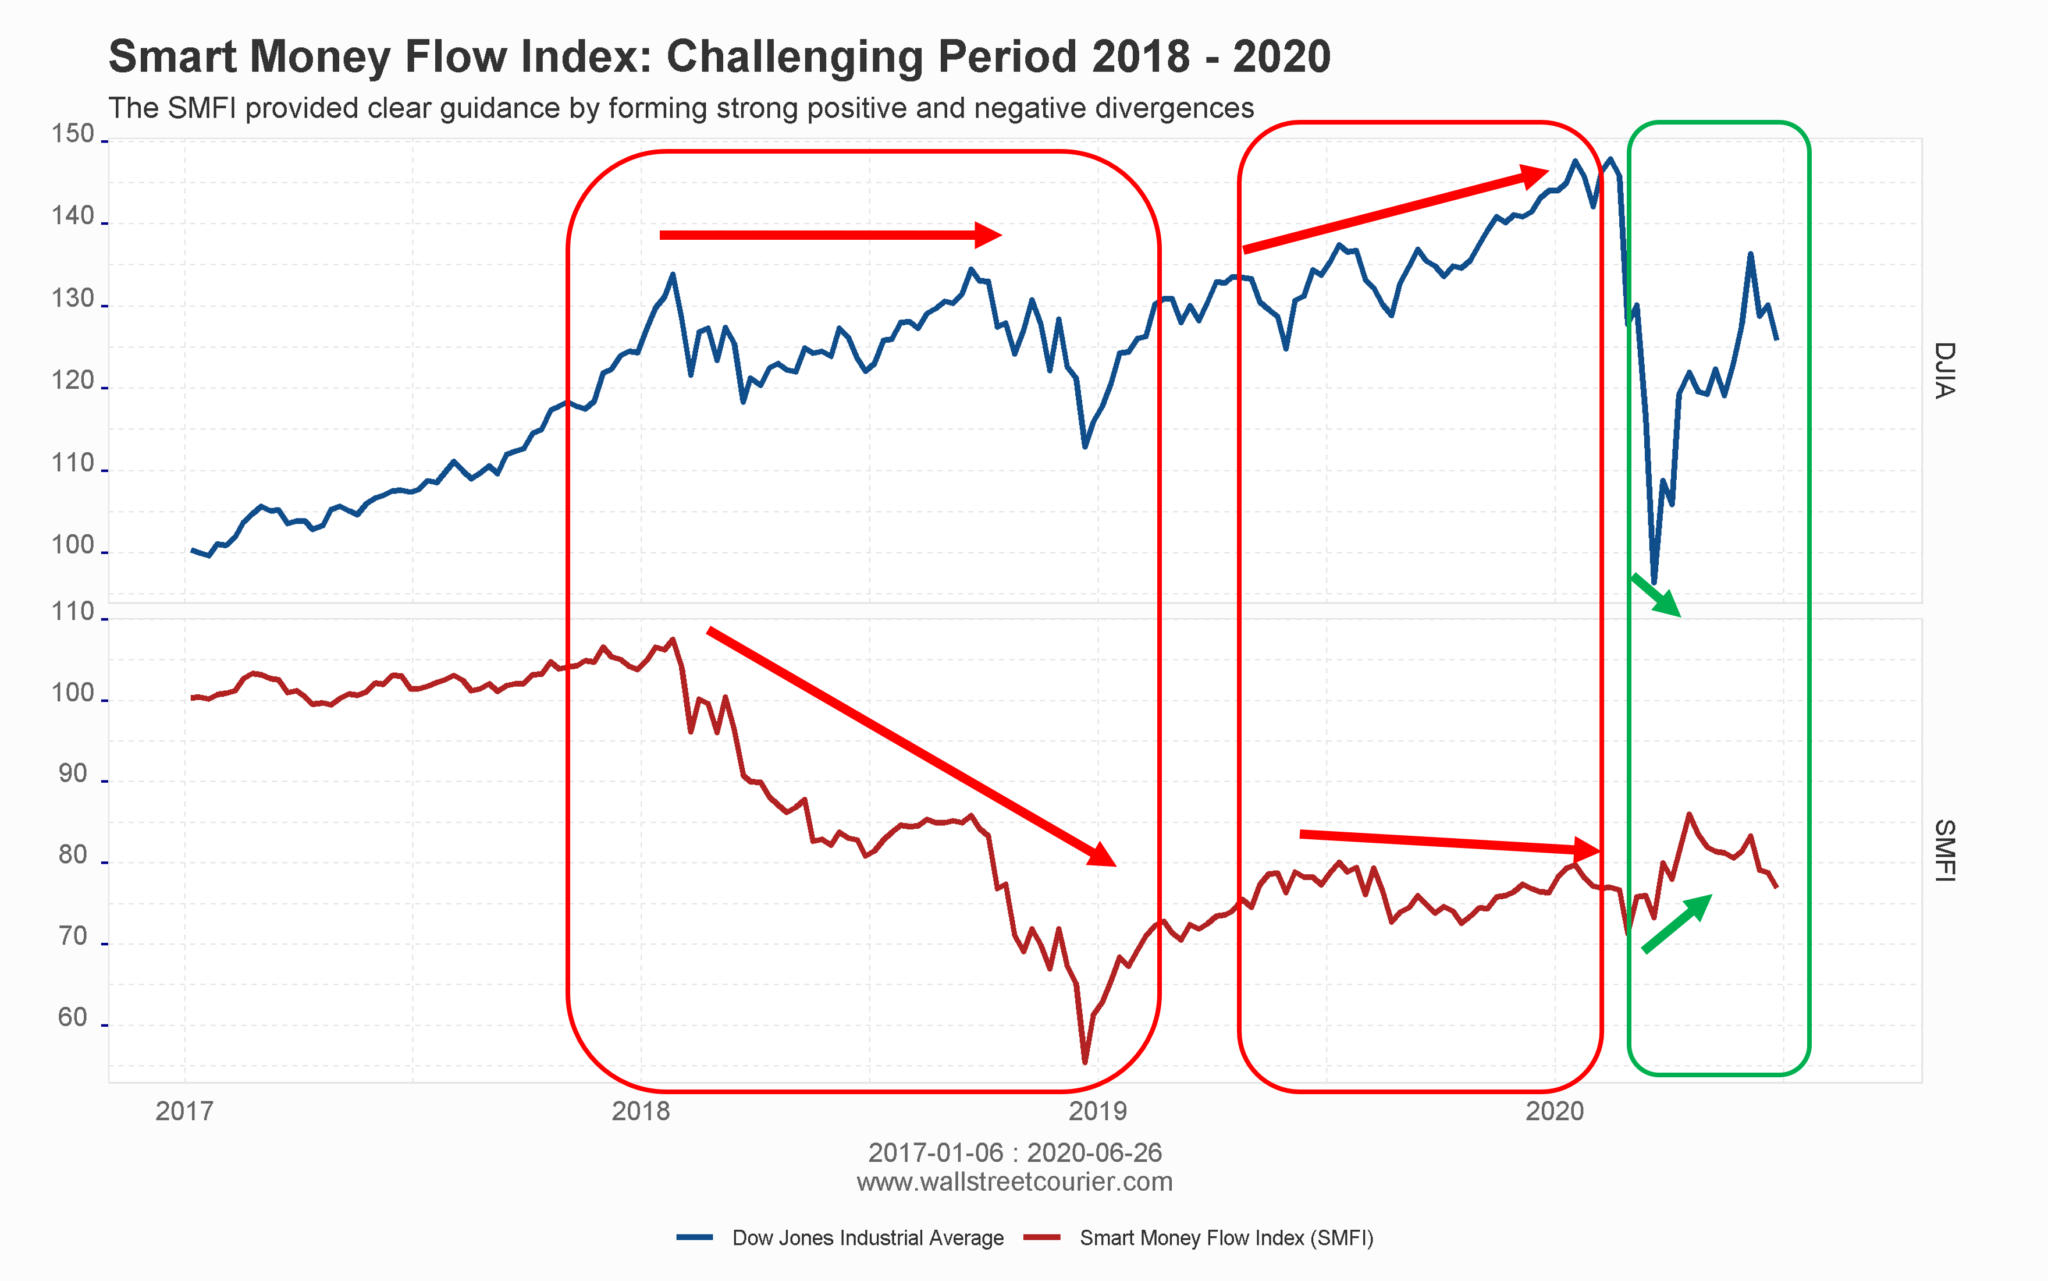
Bullish Signals: Positive divergences between the SMFI and the Dow Jones Industrial Average
Bearish Signals: Negative divergences between the SMFI and the Dow Jones Industrial Average
- Read our Guide to Understanding and Utilizing the SMFI
How to Interpret the SMFI?
- Bullish: Bullish divergences between the SMFI and the Dow Jones Industrial Average
- Bearish: Bearish divergences between the SMFI and the Dow Jones Industrial Average
Troubles in identifying precise entry and exit points? Read the full guide below:
- Unlocking the Secrets of Institutional Investors: A Comprehensive Guide to Understanding and Utilizing the Smart Money Flow Index: This guide provides an in-depth look at the Smart Money Flow Index (SMFI), an indicator that measures the buying behavior of institutional investors in the stock market. It explains the difference between the SMFI and the Smart Money Index (SMI) and how the SMFI can provide valuable insight into market movements and potential future trends
The Easy-To-Read Version of the Smart Money Flow Index:
- Since the signals of the SMFI are based on negative and positive divergences, they are often subject of interpretation. Above all, divergences can last for quite a time making it even more complicated for novice users to identify precise entry and exit points.
- For that reason, we offer an easy-to-read-version of the Smart Money Flow Index in our members section, the WSC Capitulation Index. The WSC Capitulation Index is a tool that helps investors identify precise entry and exit points in the stock market. It is based on the same formula as the Smart Money Flow Index (SMFI), but uses an additional mathematical adjustment to provide more accurate signals. This indicator is known for its ability to predict market changes with incredible timing, making it a popular choice among investors. When the Fisher Transformation of the WSC Capitulation Index passes its bearish threshold (above 0.8), it indicates that smart money is selling aggressively into the market, and dumb money is taking the opposite side of the trade. For more information, click here.
- Additionally, we offer our members the Big Picture Indicator which is condensing all signals of our published market indicators, plus the Weekly Market Regime Outlook, where we interpret the readings of all published market indicators (like the SMFI) on a weekly basis.
Further Readings About the Smart Money Flow Index
The Smart Money Flow Index (SMFI) has been featured in many articles. Below, we will provide links to some of them. The articles about the SMFI are interesting and informative, so you should definitely check them out if you have time.
- Bloomberg: Don’t Buy the Stock Rally? The Smart Money Does!
- Bloomberg: The Stock Market Rally Looks a Bit Squirrely
- Barrons: Interview with market pro Don Hays in Barron’s about the Smart Money Flow Index
- Financial Post: Follow the Smart Money to the beat market
- Bloomberg: Powell Shows Markets He Won’t Be Rattled by Volatility – The smart money may head for the hills anyway
- Godmode Trader: Technical Analyst of Godmode is talking about the Smart Money Flow Index [German]
- Bloomberg: Smart Money Buying Stocks Shows S&P 500 Rally Has Legs
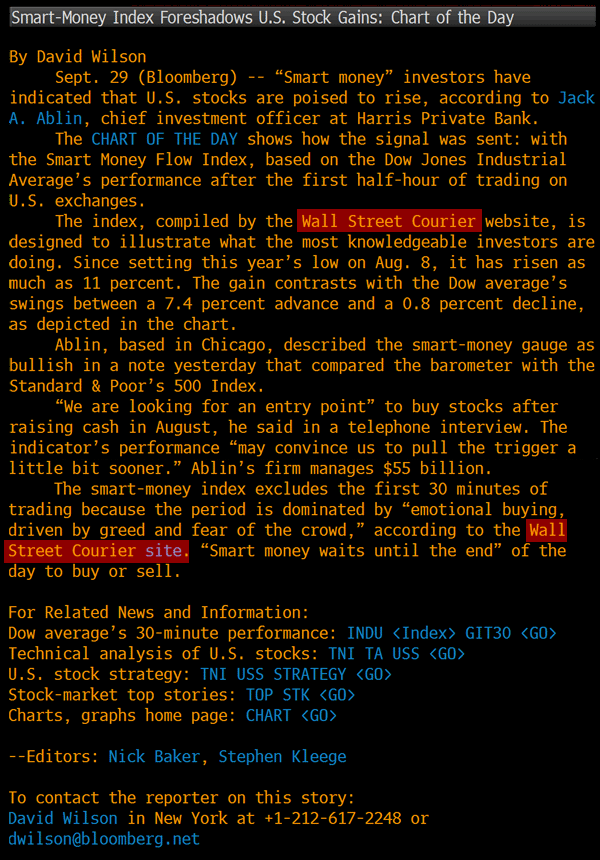
- Bloomberg: Bloomberg nominates WallStreetCourier.com’s Smart Money Flow Index as “Chart of the day”
The Idea of the Smart Money Flow Index
Identify the Buying Behavior of Smart- versus Dumb Money
The idea of the SMFI is to identify the buying behavior of Smart- versus Dumb Money in the U.S. stock market. The Smart Money Flow Index is based on the concept of Don Hays’ Smart Money Index (SMI), but uses a more efficient formula to remove emotional transactions. The SMFI was developed by R. Koch in 1997 and is a trademark of WallStreetCourier.
The Smart Money Flow Index is calculated according to a proprietary formula by measuring the action of the Dow during two periods: shortly after the opening and within the last hour. The first minutes represent emotional buying, driven by greed and fear on the part of the crowd, based on good and/or bad news. During the opening, there is also a lot of buying on market orders, as well as short covering. Smart money typically waits until the end, and they tend to test the market beforehand by shorting heavily in order to gauge the market’s reaction. Afterwards, the big investments are made. These heavy hitters tend to have the best possible information available, and they have an edge on all the other market participants.
Follow us on Twitter to get regular updates on the SMFI and on many other trading news.
The Smart Money Flow Index: A Must-Have for Investors!
Nobody Rings a Bell at Profitable Market Regimes – Smart Money Does!
Stay ahead of the market with WallStreetCourier’s expert analysis and tools. Minimize the risk of getting whipsawed, reduce the risk of unfavorable entry points, while maximizing return opportunities. Buy the dips when everybody else is throwing in the towel and exit a trade when everybody believes the market is just taking a healthy breather.
- Unlock the secrets of the Smart Money Flow Index hours before it is sent to Bloomberg, giving you a head start in understanding the market
- Identifying profitable market regimes & major inflection points will only take a 2-3 minutes a day
- Receive an easy to follow game plan for the week with our Weekly Market Regime Outlook
- Finetune your trading during the week with a detailed Big Picture drill down
- No need to spend hours in screening thousands of indicators – you’ll save valuable time and money
- Don’t waste time trying to reconcile conflicting signals – just focus on the Big Picture
- Detailed trend, smart & dumb indicator section for those who want to nerd-out
- Should you ever come across such a sophisticated approach we would appreciate it if you let us know
Follow us on Twitter or bookmark this site to stay up-to-date and never miss an update!
Can you afford to overlook the power of the SMFI?
More information and related content:
- Actionable Market Regime Outlook: Evaluates the Profitability of the Current Market Regime & Red-flags Shifts!
- Market Indicators: Measure Trend, Trend Quality and Market Sentiment to Identify Major Inflection Points
- The Big Picture Indicator: Know When To Buy The Dip & When To Trade Trends.
- WSC ETF Model Portfolios: Designed to Achieve Maximum Diversification Across all Market Regimes!
- Uncover Shifts in Major Futures Markets: CoT Indicators for 45 Futures Markets to Identify Major Shifts.
- Market Statistics: Snapshot and Analysis of key U.S. Stock Market Data.