Trend Analysis for the Dax (DAX)

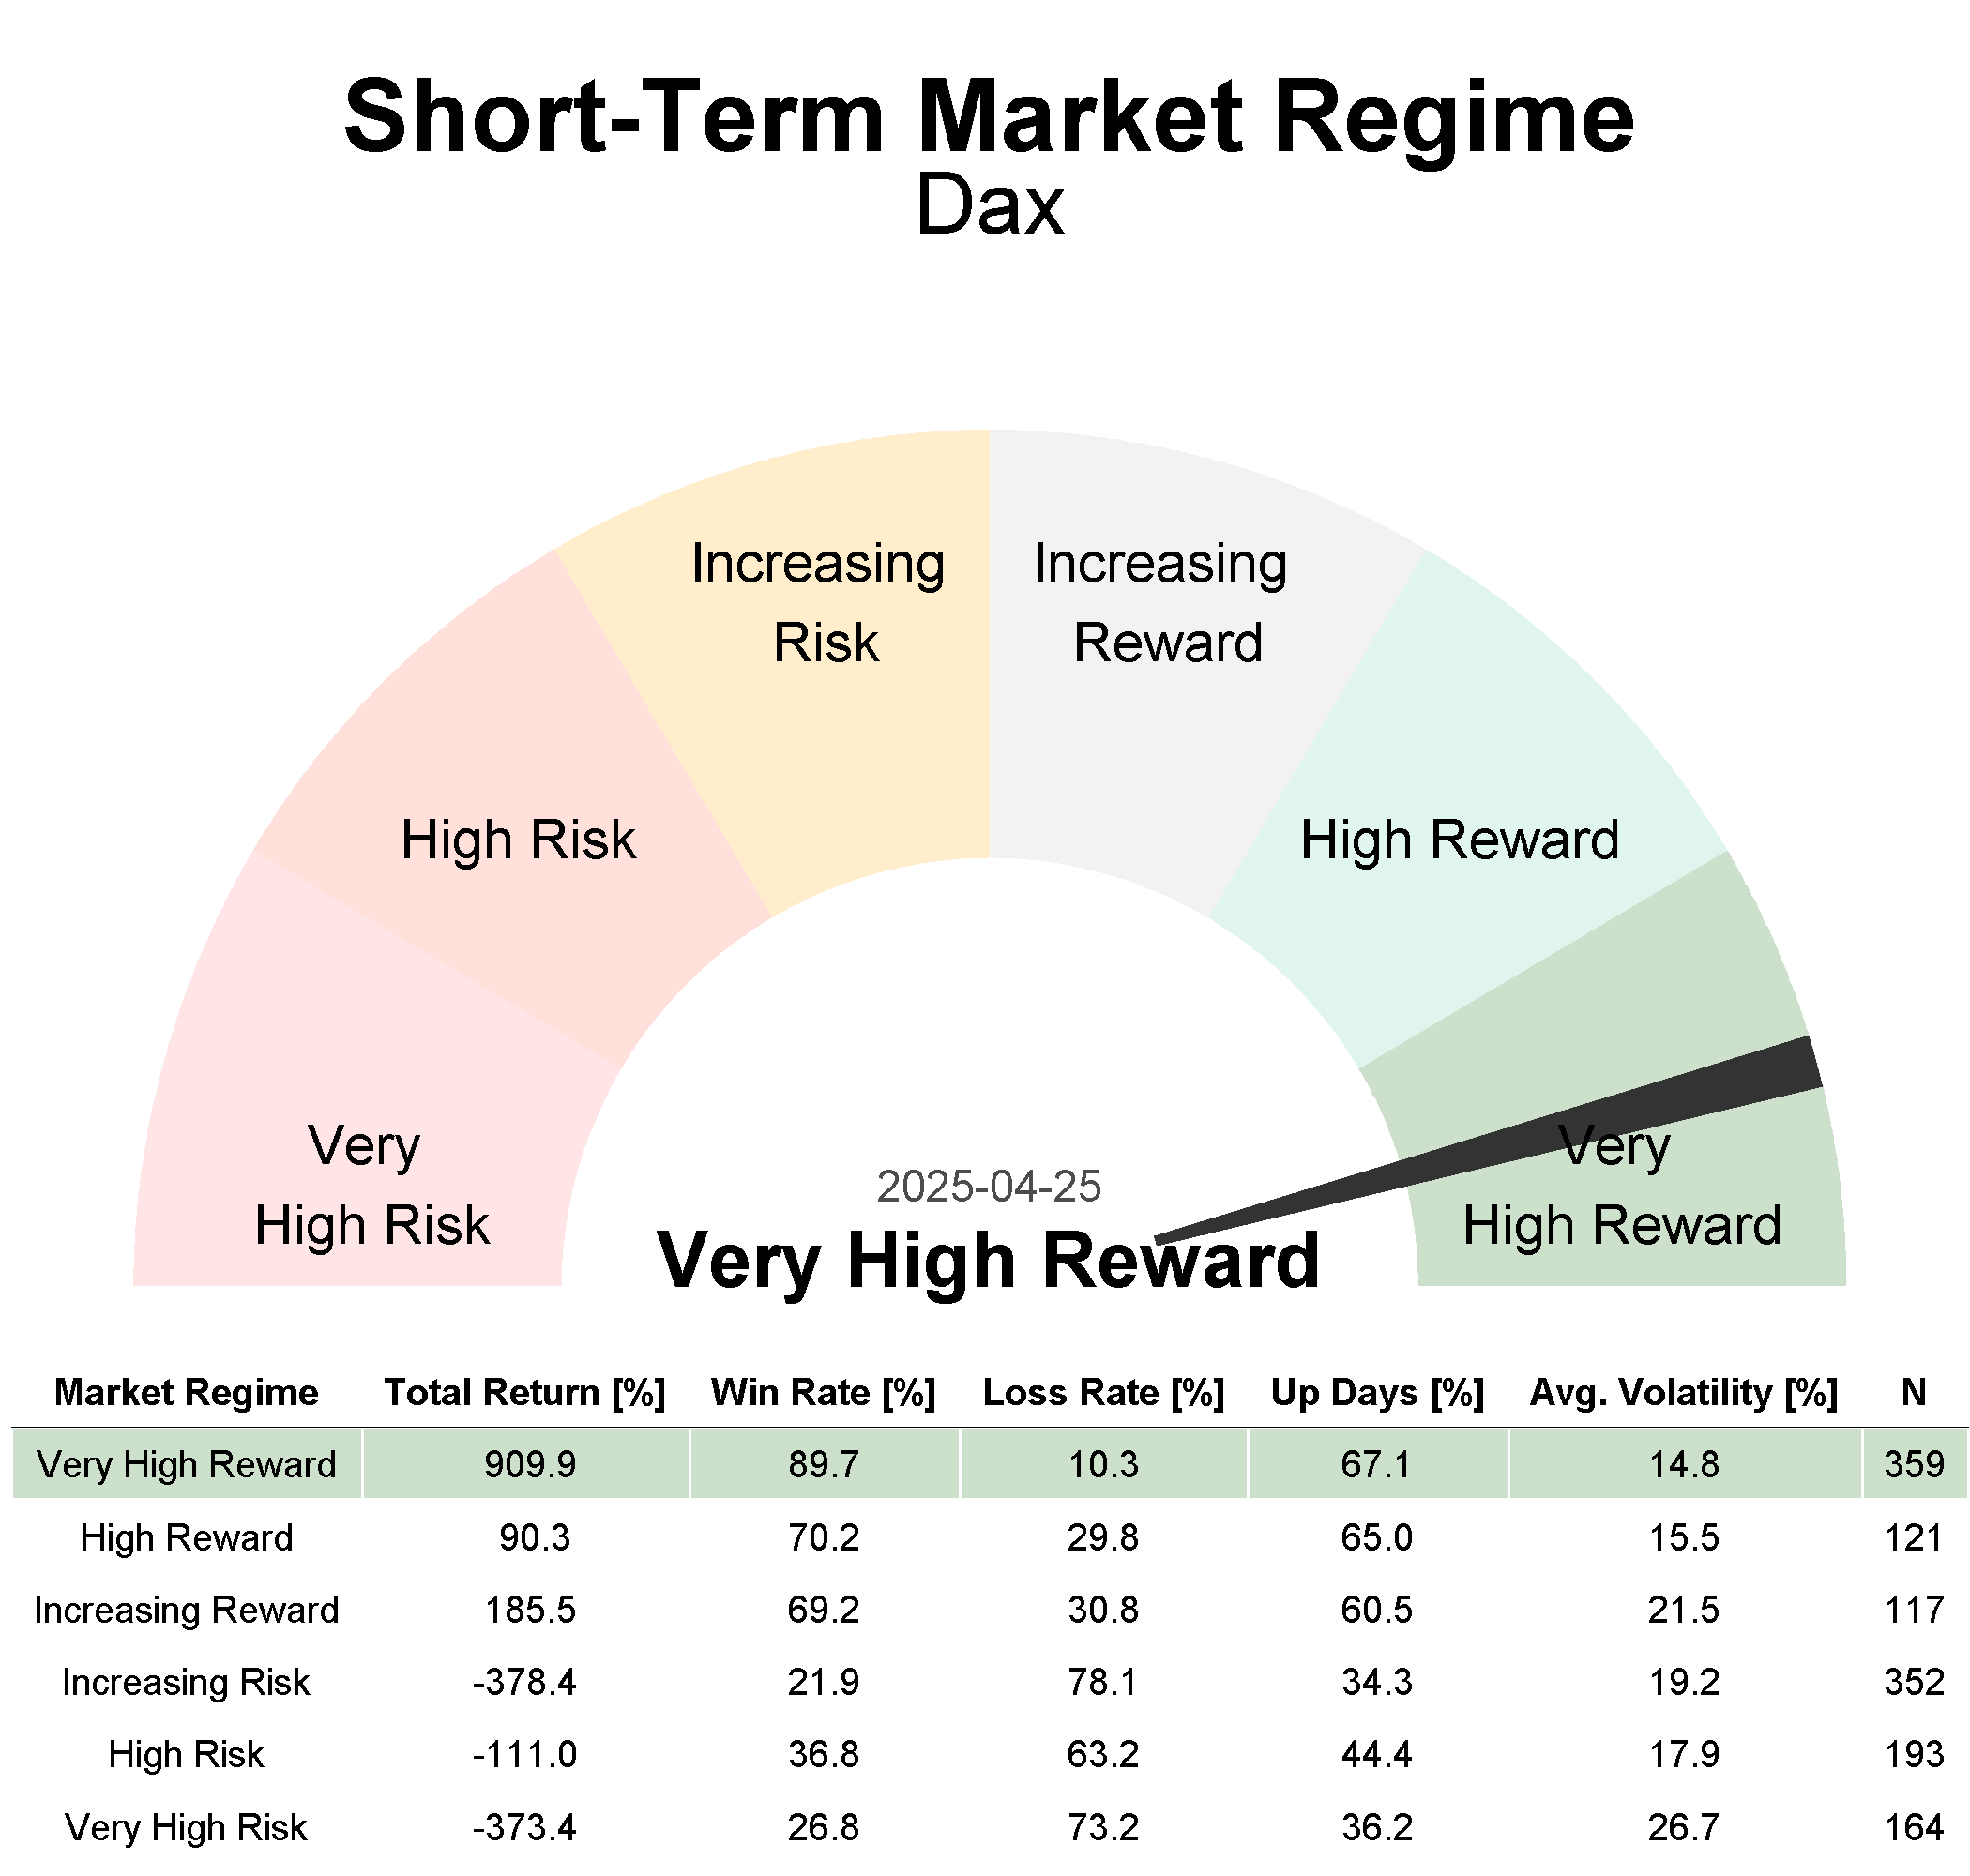
Current Market Regime for the Dax (DAX)

Market regimes are a predefined classification of trends based on their direction and strength

Negative Short-Term Market Health & Weak Mid-Term Market Health >>> High Risk

Characteristics

Resilient downtrend. Negative market regime, characterized by high and increasing volatility. Prices generally exhibit a negatively biased trend, accompanied by a wide range of stocks within the market already performing poorly. The market reacts strongly to negative news, increasing the likelihood of triggering more substantial and prolonged losses. Even if the market is not facing stronger losses immediately, given the fact that the trend is deteriorating across all time frames, the upside potential also looks extremely capped in that regime. It’s worth noting that stronger and longer-lasting corrections historically mostly began within that regime, although not every ‘High Risk Market Regime’ led to a correction/bear market. Please note that the Market Regime Gauge provides only a snapshot of current indicator signals and does not account for foreseeable signal shifts, divergences, or weak signal strength. For a more detailed view, we recommend monitoring our Short- to Long-Term Market Health Indicators and/or single indicator devlopments.

Behind Market Regimes:

Market regimes are a predefined classification of trends based on their direction and strength.

Our definition of market regimes is rooted in an extensive analysis and combination of multiple indicators across various categories (trend, trend quality, and sentiment, including dumb- and smart-money positioning) and timeframes.

In total, we have six predefined regimes ranging from ‘Very High Reward’ to ‘Very High Risk,’ each with its own distinct risk-reward characteristics. 

Weekly Trend Report: Dax (DAX)

A written assessment of relevant market indicators used to identify the Short- and Long-Term Market Regime of the S&P 500

Updated Sundays | Report based on data from 2025-08-01

Dax Index Faces Temporary Consolidation Phase

The Dax index experienced a decrease of 3.3 percent over the past week. Over the past month, it recorded a decline of 1 percent. In the three-month period, the index saw an increase of 4.1 percent. Over the past year, the Dax index rose by 29.5 percent.

Short-Term Market Health 

Currently, the short-term price trend of the Dax is negative, as it has closed below the lower envelope line of the Trend Trader Index. Additionally, this downward price movement is strongly supported by robust momentum indicators (Modified MACD and the Advance/Decline 20-Day Momentum Indicator). The only positive signal currently visible is that the trend has not yet completely broken, with both envelope lines of the Trend Trader Index holding relatively steady. This suggests the potential for higher highs and higher lows on a rolling 20-day basis. Despite this observation, the prevailing negative price trend in the Dax seems notably strong, particularly from a price perspective.

This view is strongly confirmed by the fact that the quality of this downtrend looks quite robust at the moment. We can see that the downside participation rate within the broad market still looks quite high. Thus, most of the downtrend is being driven by the broad market, rather than being the result of a few heavily weighted stocks in the market. The momentum of declining stocks is surpassing that of advancing ones, as indicated by the Modified McClellan Oscillator Daily. Furthermore, the momentum of declining volume is outpacing the momentum of advancing volume, according to the Modified McClellan Volume Oscillator Daily. Above all, volume flows into equities are negative, as shown by the Upside-/Downside Volume Index Daily. Moreover, there are more stocks reaching new yearly lows than new yearly highs, as highlighted by the New Highs minus New Lows indicator. In addition, the 5-day moving average of yearly new lows is exceeding the 5-day moving average of yearly new highs, as reflected in the High-/Low Index Daily. On the other side, the majority of stocks are trading below their 20-day moving average, signaling a negative price trend over that time period. Furthermore, most stocks are also trading below their 50-day moving average, indicating a negative price trend for the Dax during this period. All these facts are telling us that the underlying tape structure of the Dax looks quite damaged at the moment and, therefore, it is a bit too early to bet on a sustainable counter-trend rally.

On the contrarian side, we can see that the more…

The Weekly Trend Report provides a thorough written assessment of relevant market indicators used to identify the Short- and Long-Term Market Regime of the underlying market. 

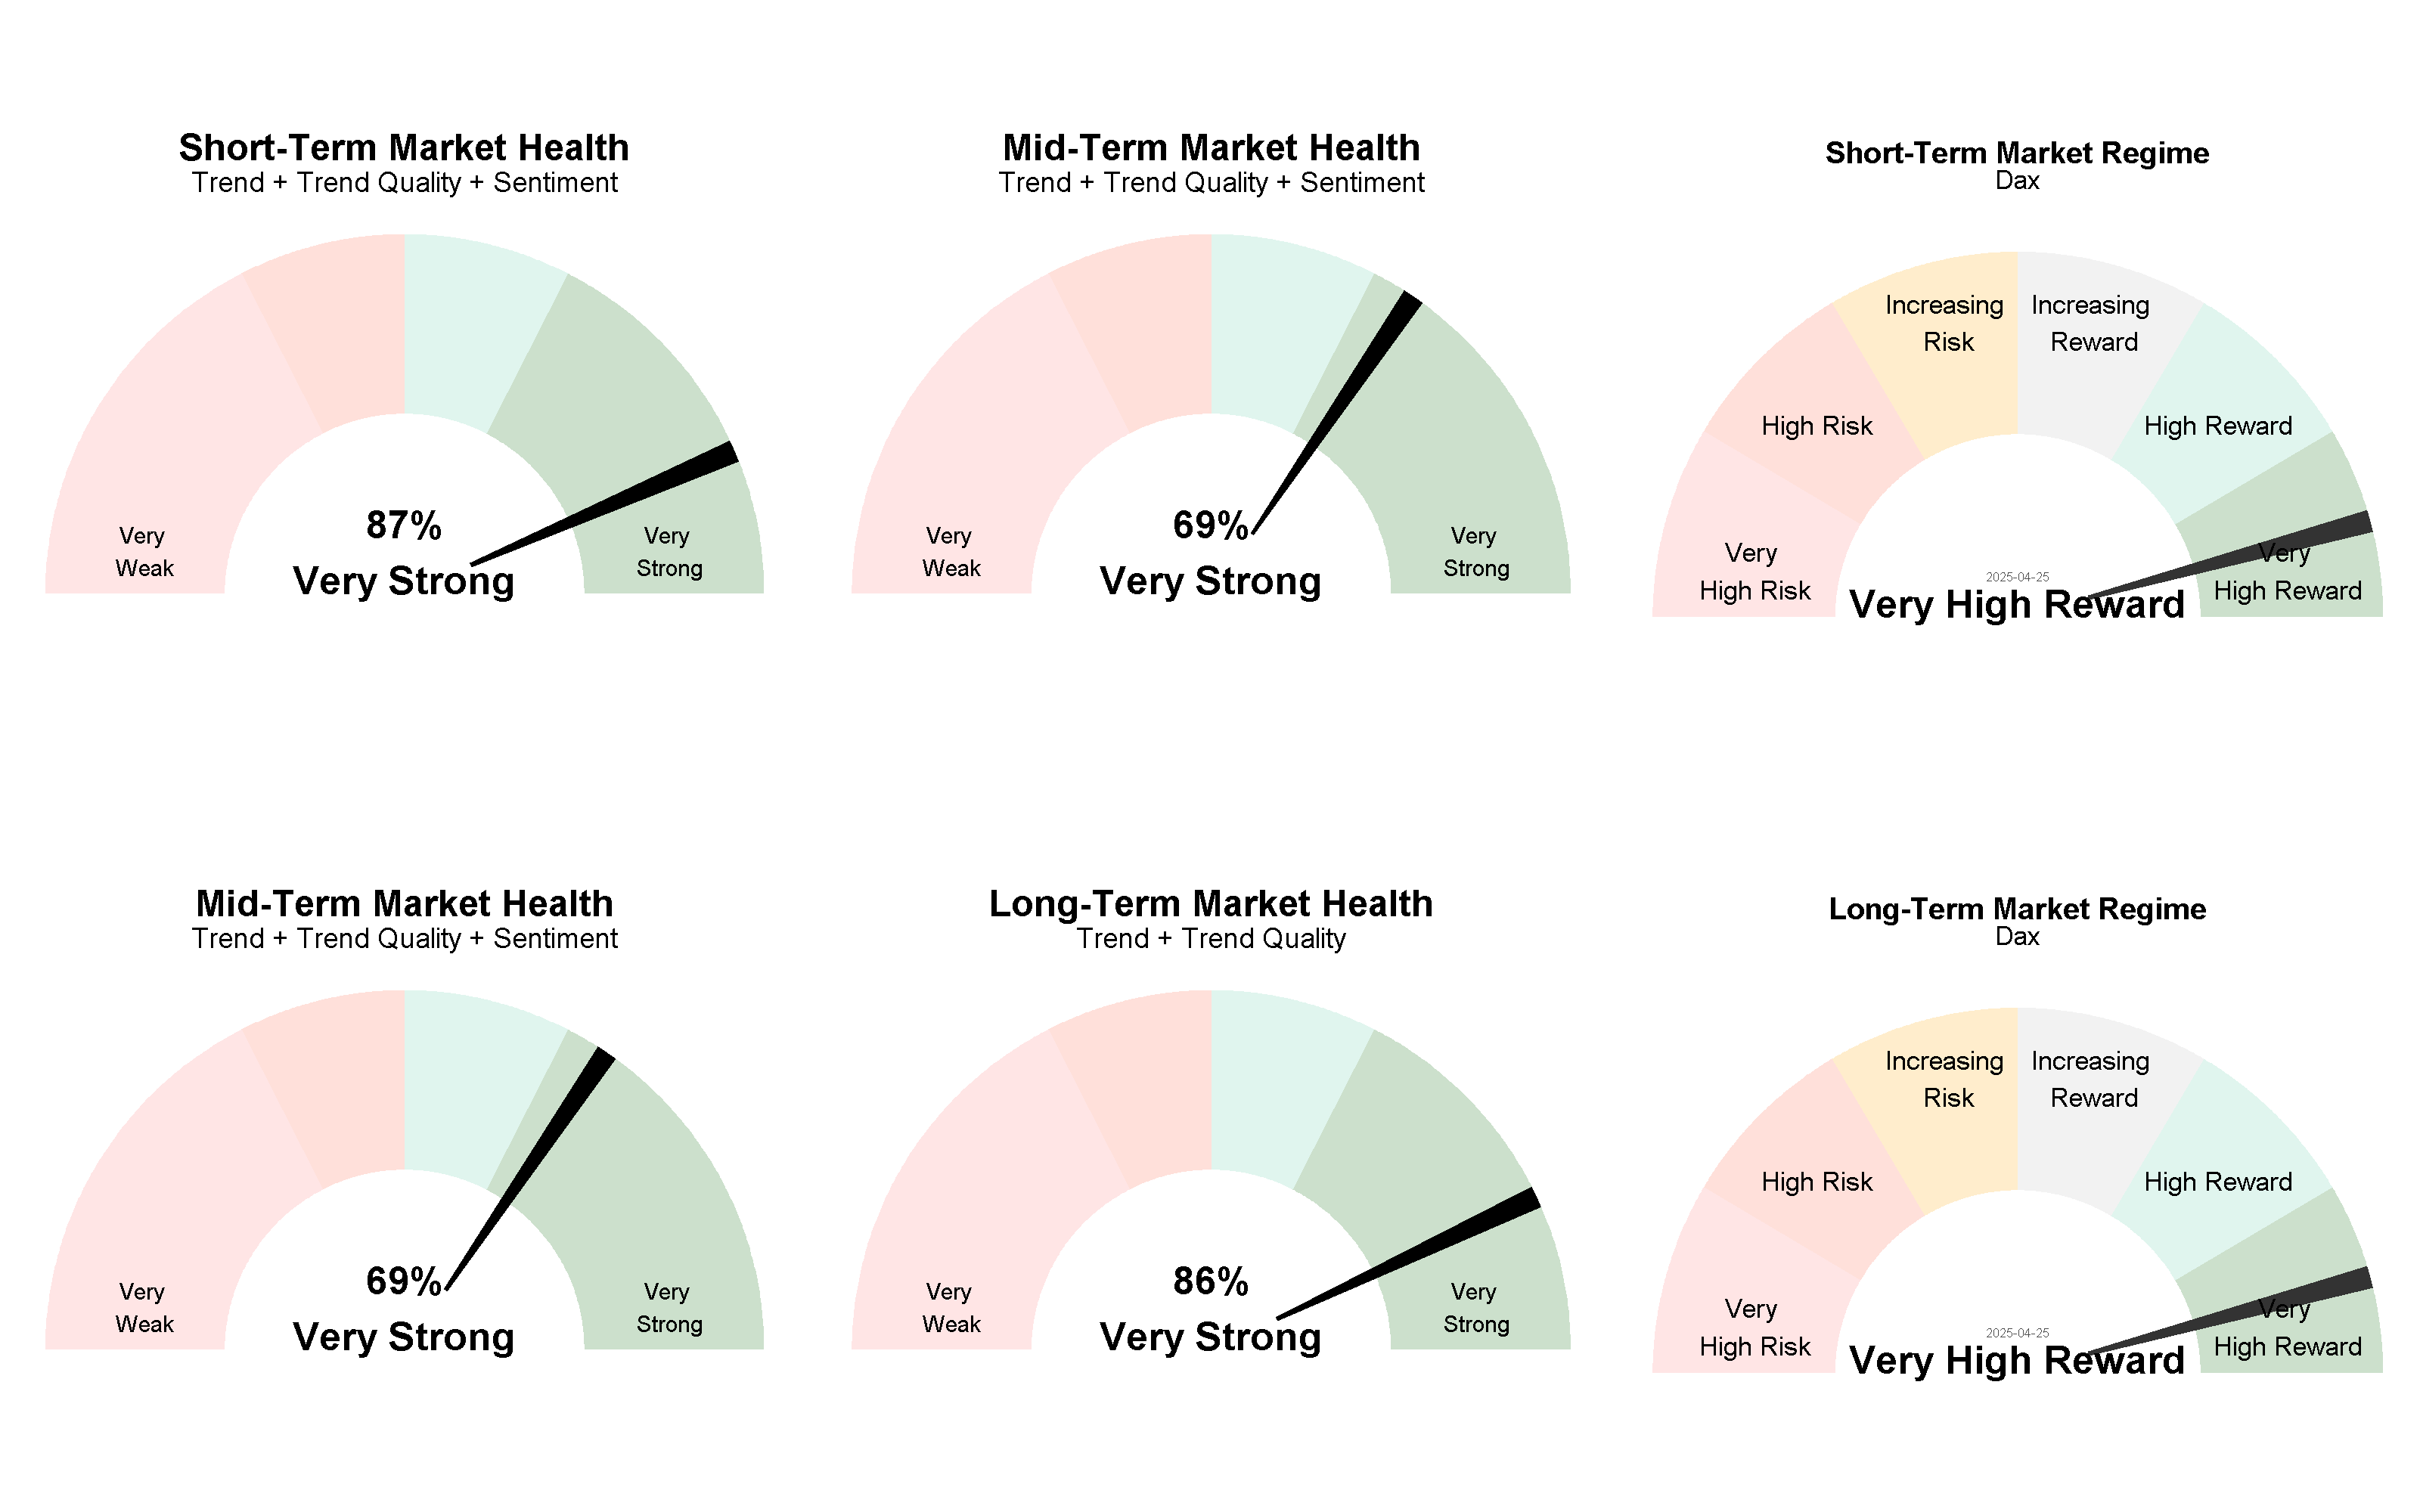
Each report follows a structured decision-making process, offering clear step-by-step instructions and complete transparency on how market regimes are identified.  The Short-Term Market Regime (for short-term traders) is constructed upon the combination of Short- to Mid-term Market Health, while the Long-Term Market Regime (for buy & hold oriented investors) is based on the combination of Mid- to Long-Term Market Health.

By regularly following our Weekly Trend Report, you’ll soon be able to interpret market trends and potential shifts based on our indicators with confidence.

Explore the Driving Forces Behind the Market Regime

To determine the market regime, we use dozens of indicator signals covering essential performance factors such as trend, trend quality, sentiment, and the positions of smart and dumb money.

Indicator Signal Analysis for the Dax (DAX)

Gauging trends through a systematic screening of signals from multiple indicators

Timeline
Static

The Indicator Dashboard provides a single, color-coded chart that displays the underlying signals from our individual market indicators for the Dax (DAX) for the past weeks. The signals are organized by category and ranked by timeframe, making it easy to visually analyze market health conditions. Mouse over for more details.

The Flowchart shows key components utilized to identify current market regimes for the  Dax (DAX). Mouse over for detailed insights.

Trends are measured through a systematic screening of signals from multiple indicators.

Organized by type and timeframe, our indicators capture essential performance factors such as trend, trend quality (breadth), and sentiment (smart and dumb money positioning), enabling us to identify strong trending markets effectively.

This diversified approach minimizes the impact of noise in individual indicators and provides an unbiased and robust view of current market conditions.

For a deeper analysis, you can screen these single indicators on our Market Regime Indicators section.

Indicator Signal Aggregation for determining Market Health for the Dax (DAX)

Measuring signal positivity among trend, trend quality, and sentiment indicators across three different timeframes

Detailed
Timeframe

The spider chart measures and aggregates signal positivity among our trend, trend quality and sentiment indicators across three different timeframes. Scores on a 0 to 100% scale represent signal positivity. Mouse over for more details.

The spider chart measures and aggregates signal positivity across three different timeframes. Scores on a 0 to 100% scale represent signal positivity. Mouse over for more details.

Determining Market Health:

Market Health Indicators measure signal positivity among all published trend, trend quality, and sentiment indicators across three different timeframes.

This diversified approach minimizes the limitations of individual indicators and provides an unbiased view of financial markets

Scores on a 0 to 100% scale denote signal positivity.

Values below 50% indicate a negative outlook, while those above 50% signal positive market health.

Signal Aggregation Over Time & Per Time Frame for the Dax (DAX)

The chart illustrates the Market Health for the Dax (DAX) over time and per timeframe. The first panel shows the Dax (DAX), followed by three subsequent panels detailing Short-, Mid-, and Long-Term Market Health. Mouse over for more details.

Market Regime Composition for the Dax (DAX)

The chart illustrates the Market Health for the Dax (DAX) over time and per timeframe. The first panel shows the Dax (DAX), followed by three subsequent panels detailing Short-, Mid-, and Long-Term Market Health. Mouse over for more details.

Current Market Regimes

The Process Beyond Market Health Analysis

Market Health Indicators offer comprehensive insights into the market condition, integrating signals from trend, trend quality, and sentiment indicators. Scores ranging from 0 to 100% represent the overall positivity of signals within a specific timeframe.

Scores below 50% indicate a negative outlook, indicating potential market weaknesses. On the other hand, scores above 50% indicate positive market health, signaling favorable conditions.

By combining short- to mid-term and mid-term to long-term market health readings, the specific market regime is determined. The Short-Term Market Regime is built upon the combination of short- to mid-term market health, while the Long-Term Market Regime is based on the combination of mid- to long-term market health.

Market Regimes Over Time for the Dax (DAX)

Below, you can observe the evolution of both short-term and long-term market regimes over the past 15 trading days.

Screen Single Indicators

Our curated selection of well-researched, highly reliable indicators analyze key performance drivers such as trend, trend quality (breadth), sentiment, and the positions of smart vs. dumb money.

Trend Indicators: Identify The Direction for Dax (DAX)

In this section, we will provide you with detailed information about the signals of Trend Indicators, utilized to identify the direction of the market. 

Trend Quality Indicators: Measure Trend Strength for Dax (DAX)

In this section, we will provide detailed information about Trend Quality Indicators, which are used to identify the strength of the trend. 

Sentiment Indicators: Identify Greed and Fear for Dax (DAX)

In this section, we will provide you with detailed information about the signals of Sentiment Indicators, utilized to identify the greed and fear among market participants. 

Market Regime Newsletter for the Dax (DAX)

Want to know how this market regime analysis is specifically applied to the Dax (DAX)? Below, you’ll find our Market Regime Newsletters where we apply our market regime analysis specifically tailored to this market.

Our Market Regime Newsletter provides a brief glimpse into our evidence-based research methodology, showcasing how our indicators and tools can effectively identify compelling investment opportunities and risk factors. With a consistent top-down research approach, the newsletter offers valuable insights into our market research methodology.

Find Trends for the Dax (DAX)

FREE MARKET RESEARCH

Only This Weekend!

13 Sep. 12:00 PM – 16 Sep. 12:00 PM (CET)

No Credit Card Needed

This weekend, all our free members with a Basic plan will have full access to premium content.
FREE MARKET RESEARCH

Only This Weekend!

13 Sep. 12:00 PM – 16 Sep. 12:00 PM (CET)

No Credit Card Needed

This weekend, all our free members with a Basic plan will have full access to premium content.
Attention.

All data is delayed!*

Please note that the content and charts are delayed and only up-to-date in our premium version. This page is primarily for demonstration purposes, showcasing how you can analyze market trends using our indicators and tools.

Please upgrade your membership to fully unlock your path to success.