This is the Logo of WallStreetCourier

Toronto Stock Market Index (TSX): Exploring Opportunities Beyond Tech!

Market Regime Newsletter

A quick glimpse into our market research

Sample Research

Here’s a sample of our Weekly Market Regime Newsletter, also serving as a blueprint for using our tools to identify profitable market regimes

Key Points:

This Market Regime Newsletter was issued on April 7th, 2024

  • Due to its high exposure to financials and energy, the Toronto Stock Exchange Index (TSX) presents a compelling case in the current market cycle.
  • Our data provides robust evidence of a promising outlook, especially when compared to tech-heavy indices with increasingly stretched valuations.
  • The positive outlook is grounded in the quite robust ‘Very High Reward‘ market regime for both the market’s short- and long-term perspectives. This indicates a robust uptrend backed by high trend quality and increasing smart money positions.
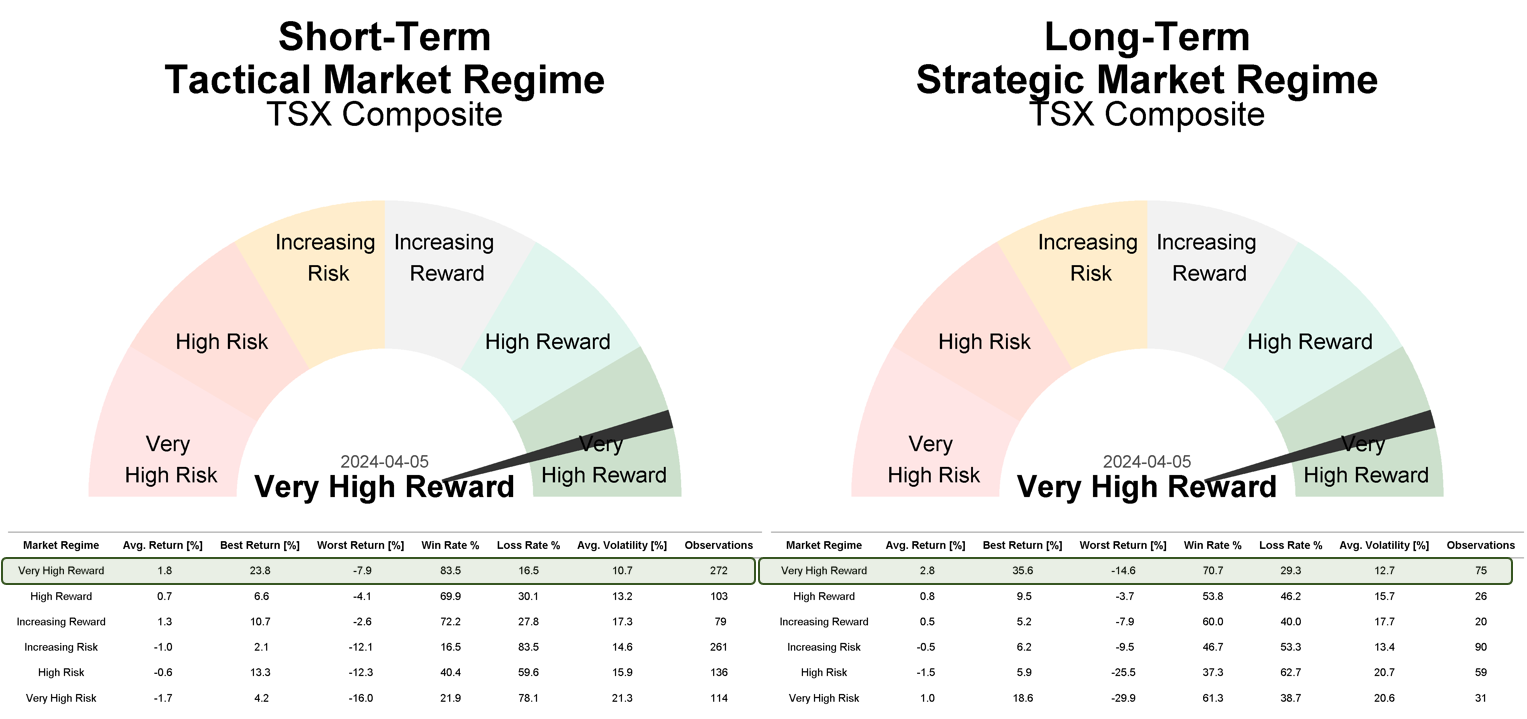
  • Historically, the TSX experienced gains in 83.5% of 272 cases during the current ‘Very High Reward Short-Term’ market regime and 70.7% of 75 cases in the ‘Very High Reward Long-Term’ market regime.

Current Market Regime of the Toronto Stock Market Index (TSX)

Description of the Current “Very High Reward” Market Regime

Strong uptrend, resulting in a highly positive market regime accompanied by significantly low volatility. Prices consistently show an upward trend, supported by a wide range of well-performing stocks within that market. Even in the face of negative news, the market demonstrates remarkable resilience with such a high positive trend quality. Weak trading days are typically short-lived overbought or sentiment driven reactions, leaving the market better positioned for further gains.

Driving Forces Behind the Current Market Regime:

Our research categorizes the market into six predefined market regimes based on trend strength and trend direction. In order to analyze these two forces, we utilize dozens of indicators signals covering essential performance factors such as trend, trend quality, sentiment, and the positions of smart and dumb money. These indicators are consolidated into Market Health Indicators, which measure signal positivity among these indicators across different timeframes for unbiased trend analysis. Scores on a 0 to 100% scale indicate signal positivity among these indicators, with values below 50% indicating a negative outlook and values above 50% indicating a positive outlook.

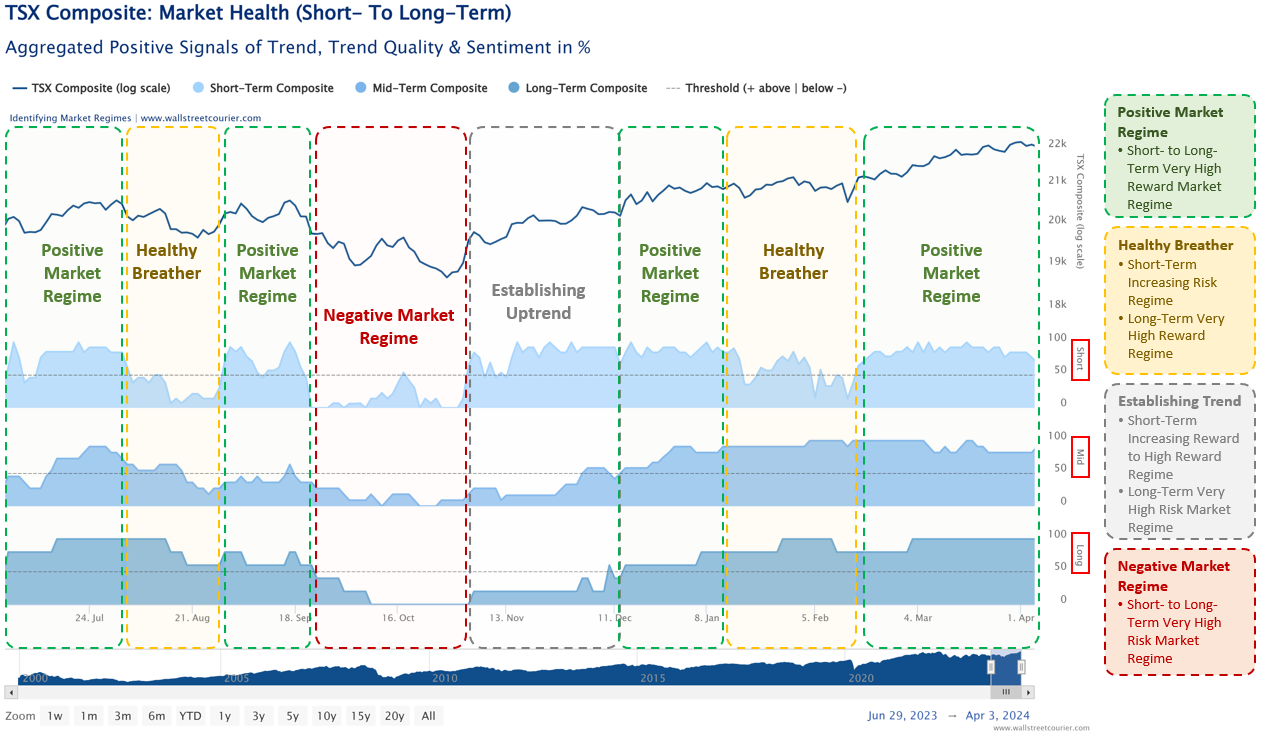
The chart below illustrates the Toronto Stock Market Index (S&P/TSX Composite index) in the first panel, followed by three subsequent panels detailing Short-, Mid-, and Long-Term Market Health over time.

Presently, Short- to Long-Term Market Health readings are showing exceptional strength, ranging between 75 and 100%. This underscores the robust nature of the current uptrend in the TSX, propelled by the majority of stocks in the index, healthy volume flows and high smart money positions. With this condition enduring, the outlook for the TSX remains compelling.

The current uptrend began in early November when Short-Term Market Health surged towards 100%, while Mid- to Long-Term Market Health remained weak. These are typical patterns indicating an emerging uptrend following a period of significant losses, triggering an ‘Increasing Reward’ market regime. In such a market regime, investors should start building up positions while awaiting further confirmation of the uptrend, based on improving Mid- to Long-Term Market Health readings. However, during this time frame, sentiment tends to be quite fearful. Consequently, many investors, driven more by emotion than facts, often hesitate to take action.

How to spot high-reward & low risk market opportunities

3 Steps for Determining Market Regimes

With our structured approach, we can identify the respective market regime for any market. Our methodology include the following steps:

1

Identify Robust Trends

  • Trends are measured through a systematic screening of signals from multiple indicators (for example the WSC Trend Index, the Smart Money Flow Index or the Daily Put-/Call Ratio All CBOE Options)
  • These indicators cover various categories (trend, trend quality, and sentiment, including dumb- and smart-money positioning) and timeframes.
  • This diversified approach minimizes the impact of noise in individual indicators and enables an unbiased and robust view of current market conditions.
2

Monitor Market Health

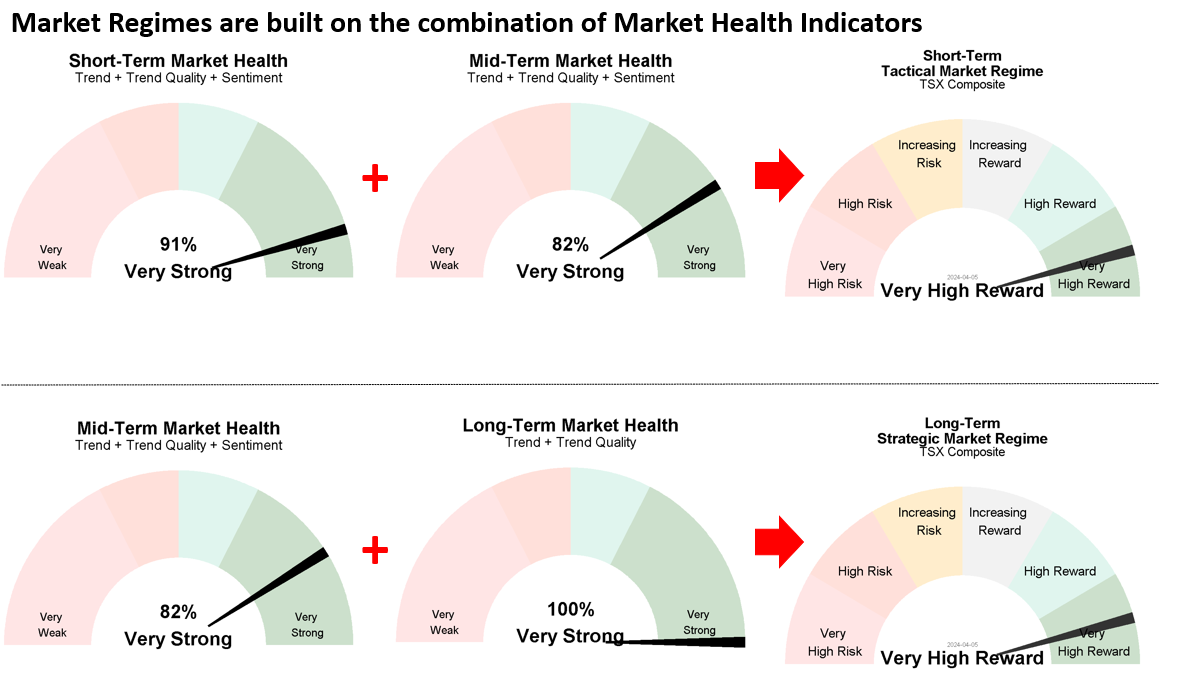
  • These indicators are representing composites of these signals for three different timeframes.
  • Scores on a 0 to 100% scale denote signal positivity.
  • Values below 50% indicate a negative outlook, while those above 50% signal positive market health.
  • The combination of these health indicators results in market regimes, indicating the strength of the current trend for a specific timeframe.

3

Determine Market Regimes

  • By combining short- to mid-term and mid-term to long-term market health readings, the specific market regime is determined.
  • These Market Regime gauges help identify market regimes and shifts without the hassle of going through all indicator signals.
  • To be more precise, the Tactical Short-Term Market Regime is constructed upon the combination of short- to mid-term market health, while the Strategic Long-Term Market Regime is based on the amalgamation of mid- to long-term market health.

Moreover, besides timely identification of strong up- and downtrends, our Market Health Indicators also enable us to differentiate between healthy and corrective consolidation periods. This capability stands as our greatest advantage, as consolidation phases represent pivotal moments. They can either serve as platforms for further gains or signal the onset of more significant downtrends. Consequently, deciding whether to capitalize on profits, take advantage of potential dips, exit the market, or even adopt a short position becomes challenging in such scenarios.

As illustrated above, healthy consolidation periods are characterized by short-term indicators turning negative, while the mid- to long-term condition remains robust. This pattern was evident from early to mid-February of this year. During such periods, the market often trades sideways, pausing momentarily before resuming its upward trajectory. The situation differed slightly from September to October 2023. Short-Term Market Health dropped below 50%, while Mid-Term Market Health also started to deteriorate, eventually falling below 50%. This served as an early warning signal, suggesting that the ongoing breather had the potential to escalate into a more significant correction. Indeed, the TSX underwent a more pronounced correction in September, with Market Health readings declining until late September, before rebounding back above 50%, indicating an impending stronger rally.

At present, Short- to Long-Term Market Health Indicators are trading at robust levels across all timeframes. This indicates persistent strength among various indicators, including MACD, RSI, stocks above 20/50/100/150/200-day moving averages, new highs vs. new lows, smart money positions, and other sentiment indicators such as call-put ratios and sentiment surveys. This reinforces our optimistic outlook, at least until mid- to long-term Market Health continues trading above 50%.

From Market Health Indicators To Market Regimes:

These positive Market Health Readings are also reflected in our Market Regimes Gauges below. By combining short- to mid-term and mid-term to long-term market health readings, the specific market regime is determined. These Market Regime gauges help identify market regimes and shifts without the hassle of going through all indicator signals. To be more precise, the Short-Term Market Regime is constructed upon the combination of short- to mid-term market health, while the Long-Term Market Regime is based on the amalgamation of mid- to long-term market health.

What the history tells us about the current Market Regimes

Since the availability of full market regime data dating back to 2000, the S&P/TSX Composite Index (TSX) has entered a ‘Very High Reward’ market regime 272 times from a short-term perspective and 75 times from a long-term perspective. These market regimes are characterized by Short- to Long-Term Market Health readings above 50%. Remarkably, in 83.5% of these instances, Canadian stocks yielded a total cumulative gain of 500.8% for short-term traders and 210% for strategic long-term-oriented investors. Additionally, the average volatility within these regimes ranged between 10% and 12%, which is quite low.

The Bottom Line

  • With the ‘Very High Reward’ market regime persisting across both timeframes, the outlook for the Toronto Stock Market Index (TSX) remains highly compelling.
  • Moreover, the high exposure to financials and energy stocks warrants closer attention, especially given the stretched valuations in the tech sector.
  • While temporary consolidation periods may occur, the risk of a major trend reversal remains low as long as Mid- to Long-Term Market Health maintains its strong readings, supporting a positive market regime.