
S&P 500 · SPX · North America
The daily data-driven S&P 500 analysis: where the S&P 500 stands, how Trend, Breadth and Investor Sentiment define the current Market Regime, and how comparable setups have unfolded since 1985.
High Reward Regime Starts, Risk-On Phase Early and Extremely Stable
The S&P 500 advanced 0.6% on Friday, closing at 7811.5 after trading between 7779.3 and 7820.6, with 62.1% of constituents rising and 2.9% reaching new 52-week highs, while 1.6% marked new 52-week lows; advancing stocks accounted for 49.5% of volume.
Full Access. No Delay.
Basic members get free daily access to one selected market. Premium members get daily access to all 29 markets, including the S&P 500.
Start free · No credit card required
A compact analysis of the S&P 500 indicators: Trend, Trend Quality (Breadth), and Sentiment across the short- and mid-term horizon, including Smart Money and Dumb Money positioning.
Short-term TREND indicators remain constructive, with the Trend Trader Index Lines showing both envelopes rising, confirming the ongoing strength of the short-term price trend. The market continues to trade above the upper envelope of the Trend Trader Index, reinforcing a bullish bias. The Modified MACD sustains its positive momentum, and the close above the 50-day EMA, which itself is rising, further underpins the prevailing uptrend. However, the Advance-/Decline 20 Days Momentum remains negative, highlighting some internal weakness among advancing and declining stocks. The WSC Short-Term Trend Index continues to signal caution, as the percentage of stocks trading above their 26-week highs remains subdued. Overall, the short-term TREND structure is robust, but not without pockets of underlying breadth fragility.
TREND QUALITY improved notably, advancing from its previous reading as participation broadened. The Percentage of Stocks Above 20-Day MA turned bullish versus the prior session, indicating a greater share of constituents are now participating in the short-term rally. Both the Modified McClellan Oscillator Daily and the Modified McClellan Volume Oscillator Daily also turned bullish, reflecting a shift in momentum as advancing stocks and volumes outpace decliners. The New Highs vs. New Lows Daily indicator continues to show more stocks reaching new yearly highs than lows, supporting the quality of the uptrend. Nonetheless, the Percentage of Stocks Above 50-Day MA remains negative, with most stocks still below this threshold, and the Upside-/Downside Volume Index Daily continues to reflect negative volume flows. These mixed signals suggest that while TREND QUALITY has improved, breadth and volume participation are not yet fully aligned with the headline strength.
SENTIMENT remains firmly positive, with the CBOE Total Put-/Call Ratio Daily holding neutral and not detracting from the overall constructive tone. The 9-to-1 Up-/Down Days indicator remains neutral, indicating no extreme institutional buying or selling pressure at present. The Percentage of Stocks with RSI(14) below 30 continues to highlight an extremely oversold condition, with more than a quarter of constituents registering oversold readings in the past three days, which increases the likelihood of a short-lived oversold bounce. Conversely, the Percentage of Stocks with RSI(14) above 70 remains neutral, suggesting the market is not yet overbought. Realized Volatility (10d) is trading below its 25th percentile, which is supportive for risk-taking. Overall, SENTIMENT indicators continue to favor a positive short-term outlook, with oversold conditions and low volatility providing a constructive backdrop.
Mid-term TREND indicators remain supportive, with the WSC Mid-Term Price Trend confirming a bullish stance and the market closing above its 100-day EMA, which continues to rise. These signals underscore the resilience of the mid-term uptrend. However, the WSC Trend Index continues to flag caution, as the percentage of stocks trading above their 52-week highs remains weak, indicating that leadership is still relatively narrow. The underlying price trend on a 100-day and 150-day basis remains negative, as the majority of stocks are trading below these moving averages. This divergence between index-level strength and constituent participation suggests that while the mid-term TREND is intact, it is not broadly supported across the index.
TREND QUALITY remains subdued at zero, unchanged from the previous observation, reflecting persistent weakness in breadth and momentum participation. The Percentage of Stocks Above 100-Day MA and 150-Day MA both remain negative, with most stocks still below these key thresholds. The Modified McClellan Oscillator Weekly continues to indicate that declining stocks are outpacing advancers on a weekly basis, and the Advance-/Decline Index Weekly confirms that the number of declining issues exceeds advancing ones, highlighting a vulnerable tape. The Upside-/Downside Volume Index Weekly also remains negative, with declining volume outpacing advancing volume, pointing to weak demand. These indicators collectively underscore that, despite headline index strength, the quality of the mid-term trend remains fragile.
SENTIMENT in the mid-term remains neutral, with no material change from the previous session. Realized Volatility (20d) continues to trade below its 25th percentile, which is a constructive signal for risk appetite. The WSC Capitulation Index FT indicates that smart money flows are supportive, and the AAII Bulls & Bears Survey turned bullish versus the prior day, signaling a structural bull-market bias among individual investors. However, the Hindenburg Omen remains active, highlighting increased downside risk within a 30-day window due to weak market breadth. The Smart Money Flow Index does not confirm current market levels, and the WSC Capitulation Index shows negative momentum in smart money flows. The Z-Score Put-/Call Ratio remains neutral. Overall, SENTIMENT is mixed, with positive signals from volatility and survey data offset by cautionary breadth and smart money indicators.
The S&P 500 is positioned within a Weak Structural Bull Market, as defined by Long-Term Market Health. The current regime is classified as High Reward and Risk-On, reflecting a tactical environment where Short-Term Market Health is notably strong while Mid-Term Market Health remains subdued. This combination places the market in a constructive but not fully robust phase, with mixed momentum across time horizons.
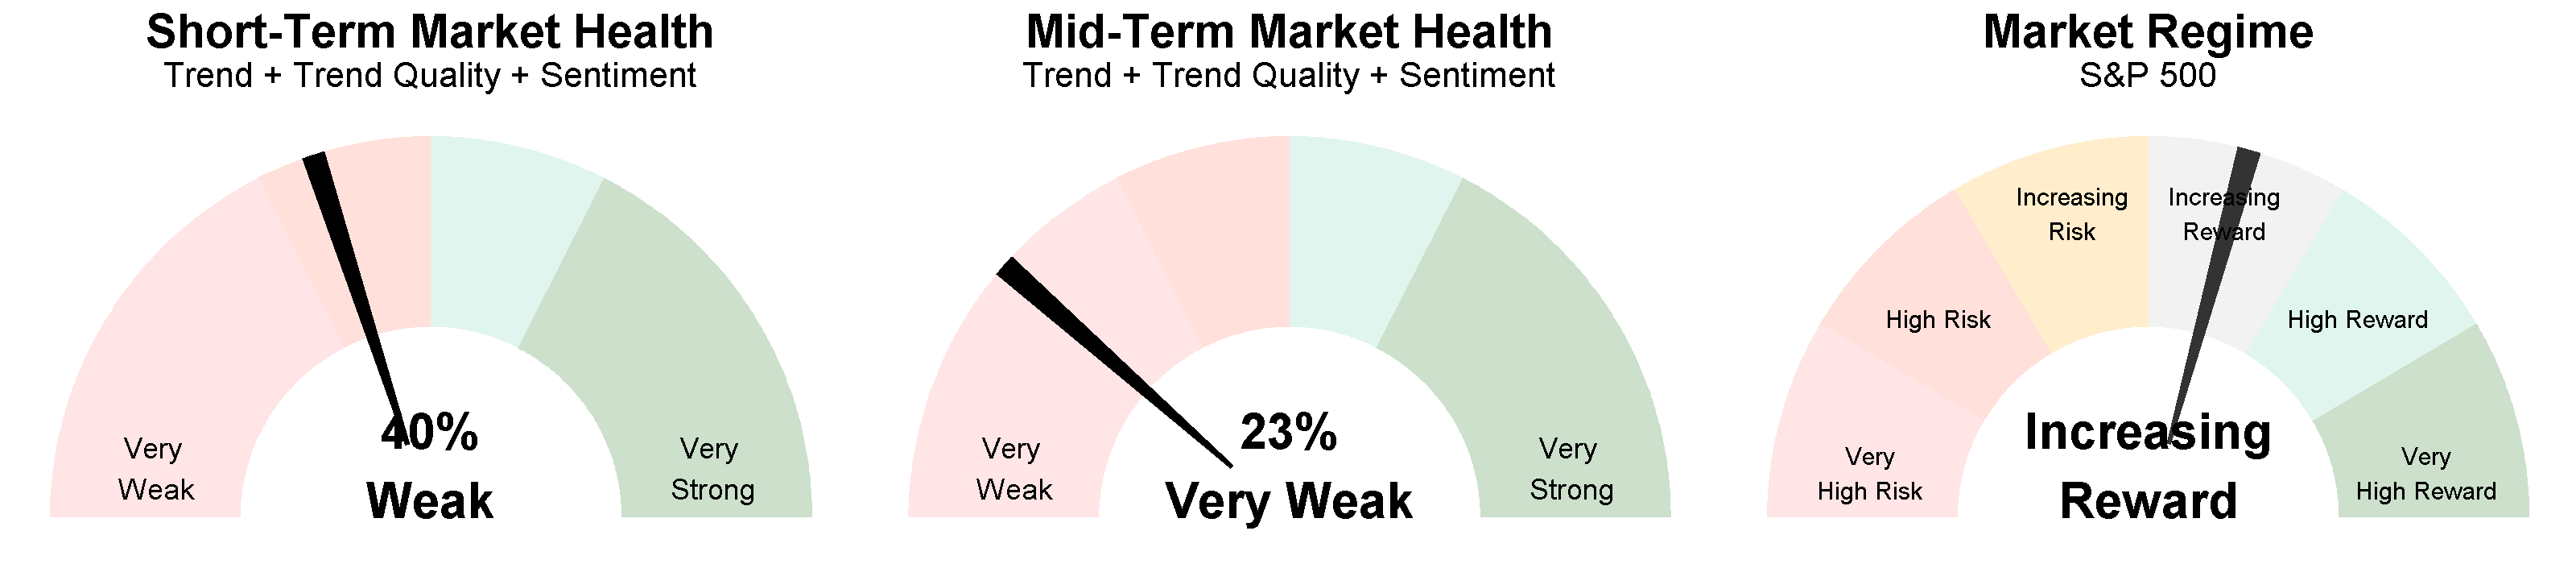
Historically, this regime has delivered an annualized return of +35.7% with a Sharpe ratio of 2.17, roughly three times the buy-and-hold baseline of +12.5%, at broadly similar volatility. The average maximum drawdown stands at -0.5%, and the up-day rate is 54.98%, based on a sample of 136 episodes since 1985.
Historical return of the S&P 500 je Marktphase: die Entwicklung der sechs Market Regimes seit 1985 im Vergleich zur Buy-and-Hold-Benchmark. Die aktuelle Marktphase ist als Aktiv gekennzeichnet.
High Reward| Market Regime | Zeitanteil | Episoden | Rendite p.a. | Positive Tage | Ø positiver Tag | Ø negativer Tag | Volatilität | Sharpe |
|---|---|---|---|---|---|---|---|---|
| Risk-On · 70.7% der Zeit | ||||||||
| Very High Reward | 62.8% | 393 | 26.9% | 56.3% | 0.6% | -0.5% | 11.5% | 2.33 |
| High Reward | 4.0% | 136 | 35.7% | 55.0% | 0.8% | -0.7% | 16.5% | 2.17 |
| Increasing Reward | 4.0% | 99 | 37.8% | 55.5% | 1.1% | -1.1% | 22.8% | 1.66 |
| Risk-Off · 29.3% der Zeit | ||||||||
| Increasing Risk | 14.8% | 390 | -16.9% | 49.5% | 0.7% | -0.8% | 15.9% | -1.06 |
| High Risk | 4.6% | 196 | -12.6% | 48.8% | 0.7% | -0.8% | 16.9% | -0.74 |
| Very High Risk | 9.9% | 157 | -32.1% | 48.4% | 1.5% | -1.6% | 37.9% | -0.85 |
| Benchmark · Buy & Hold | ||||||||
| All Periods | 100.0% | n/a | 12.5% | 54.4% | 0.7% | -0.7% | 17.3% | 0.72 |
Returns annualized; up-day share, average daily returns, volatility and Sharpe Ratio based on historical daily data since 1985. Past performance is no guide to future results.
Short-term outcomes have historically been mixed under similar conditions, with positive and negative returns occurring at comparable rates over the next day, week, and month. The current Short-Term and Mid-Term Market Health scores suggest that near-term advances are possible but not reliably persistent, and the historical pattern does not show a clear bias toward sustained upside in the immediate period. As such, the short-term outlook is neutral, with no strong directional tendency evident.
The current combination of Short-Term and Mid-Term Market Health places the regime in an extremely stable state, with a 97.7% probability of remaining in Risk-On territory over the next five trading days (High Reward 59.1%, Very High Reward 36.4%, Increasing Reward 2.3%).
The historical pattern in this regime has favored maintaining exposure rather than aggressively increasing or reducing risk. Positioning has typically leaned toward ongoing participation, allowing for tactical flexibility as conditions evolve. The bias has generally been to remain engaged while avoiding significant allocation shifts.
You are currently viewing a placeholder content from X. To access the actual content, click the button below. Please note that doing so will share data with third-party providers.
More Information